Answered step by step
Verified Expert Solution
Question
1 Approved Answer
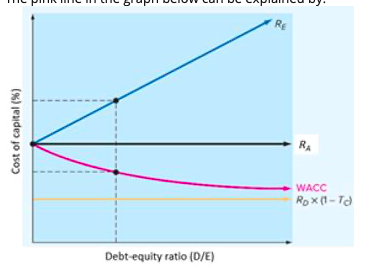
The pink line in the graph below can be explained by: a. Pecking order Theory b. Static Theory c. M&M Proposition (with taxes) d. M&M
The pink line in the graph below can be explained by:

| a. | Pecking order Theory | |
| b. | Static Theory | |
| c. | M&M Proposition (with taxes) | |
| d. | M&M Proposition (no taxes) | |
| e. | CAPM Theory |
Step by Step Solution
There are 3 Steps involved in it
Step: 1

Get Instant Access to Expert-Tailored Solutions
See step-by-step solutions with expert insights and AI powered tools for academic success
Step: 2

Step: 3

Ace Your Homework with AI
Get the answers you need in no time with our AI-driven, step-by-step assistance
Get Started


