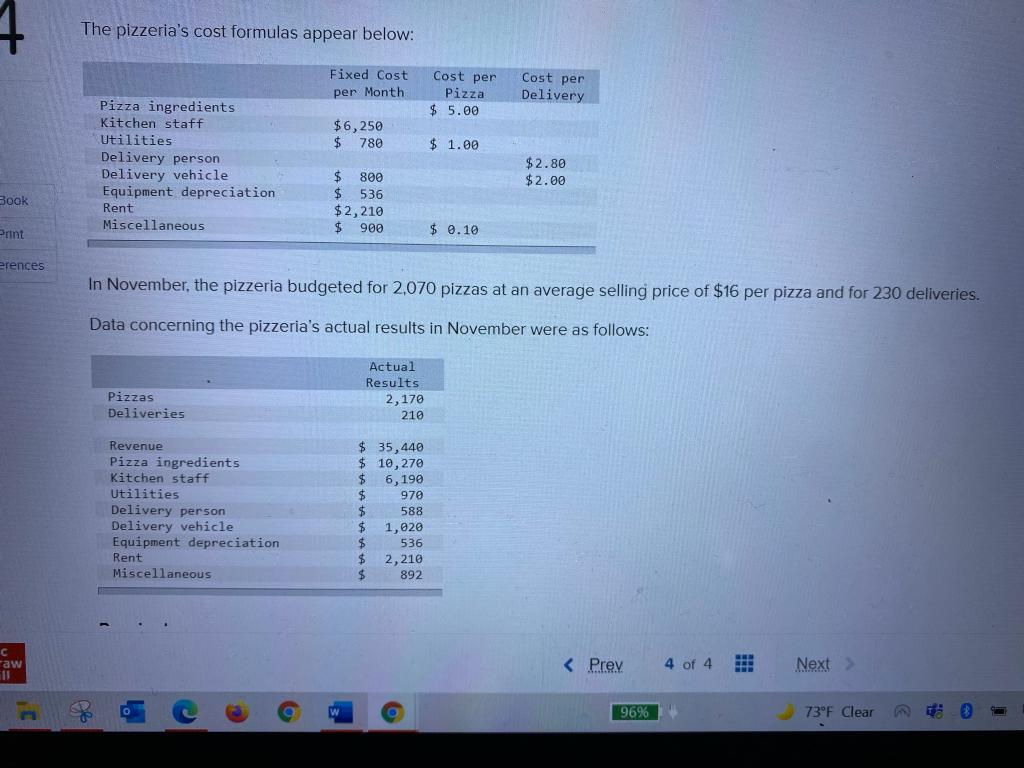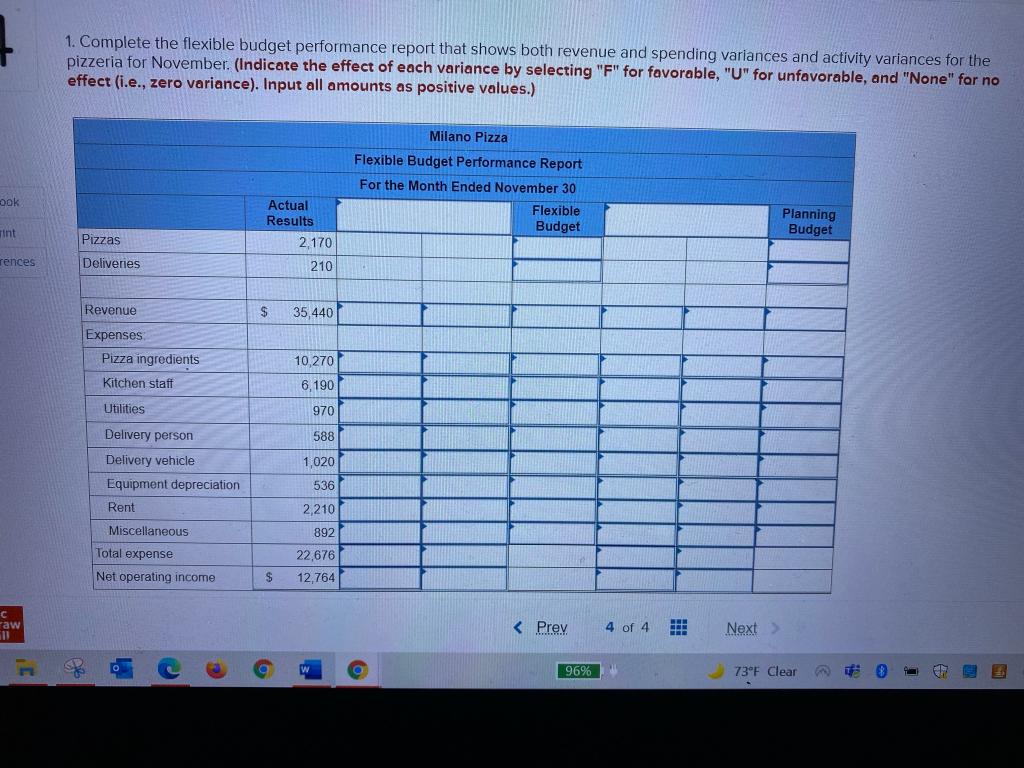

The pizzeria's cost formulas appear below: Fixed Cost per Month Cost per Pizza $ 5.00 Cost per Delivery Pizza ingredients Kitchen staff Utilities Delivery person Delivery vehicle Equipment depreciation $6,250 $ 780 $ 1.00 $2.80 $2.00 Book Rent $ 800 $ 536 $2,210 $ 900 Miscellaneous Print $ 0.10 erences In November, the pizzeria budgeted for 2,070 pizzas at an average selling price of $16 per pizza and for 230 deliveries. Data concerning the pizzeria's actual results in November were as follows: Pizzas Deliveries Actual Results 2,170 210 Revenue Pizza gredients Kitchen staff Utilities Delivery person Delivery vehicle Equipment depreciation Rent Miscellaneous $ 35,440 $ 10, 270 6,190 $ 970 $ 588 $ 1,020 $ 536 $ 2,210 $ 892 aw 1. 2 96% 73F Clear 3 1. Complete the flexible budget performance report that shows both revenue and spending variances and activity variances for the pizzeria for November. (Indicate the effect of each variance by selecting "F" for favorable, "U" for unfavorable, and "None" far no effect (i.e., zero variance). Input all amounts as positive values.) Milano Pizza Flexible Budget Performance Report For the Month Ended November 30 Flexible Budget ook Actual Results 2.170 Planning Budget Tint Pizzas Deliveries rences 210 $ 35,440 Revenue Expenses Pizza ingredients Kitchen staff 10,270 6,190 Utilities 970 Delivery person 588 1,020 Delivery vehicle Equipment depreciation Rent 536 2,210 Miscellaneous Total expense Net operating income 892 22,676 12.764 $ raw TU e a 96% 73F Clear The pizzeria's cost formulas appear below: Fixed Cost per Month Cost per Pizza $ 5.00 Cost per Delivery Pizza ingredients Kitchen staff Utilities Delivery person Delivery vehicle Equipment depreciation $6,250 $ 780 $ 1.00 $2.80 $2.00 Book Rent $ 800 $ 536 $2,210 $ 900 Miscellaneous Print $ 0.10 erences In November, the pizzeria budgeted for 2,070 pizzas at an average selling price of $16 per pizza and for 230 deliveries. Data concerning the pizzeria's actual results in November were as follows: Pizzas Deliveries Actual Results 2,170 210 Revenue Pizza gredients Kitchen staff Utilities Delivery person Delivery vehicle Equipment depreciation Rent Miscellaneous $ 35,440 $ 10, 270 6,190 $ 970 $ 588 $ 1,020 $ 536 $ 2,210 $ 892 aw 1. 2 96% 73F Clear 3 1. Complete the flexible budget performance report that shows both revenue and spending variances and activity variances for the pizzeria for November. (Indicate the effect of each variance by selecting "F" for favorable, "U" for unfavorable, and "None" far no effect (i.e., zero variance). Input all amounts as positive values.) Milano Pizza Flexible Budget Performance Report For the Month Ended November 30 Flexible Budget ook Actual Results 2.170 Planning Budget Tint Pizzas Deliveries rences 210 $ 35,440 Revenue Expenses Pizza ingredients Kitchen staff 10,270 6,190 Utilities 970 Delivery person 588 1,020 Delivery vehicle Equipment depreciation Rent 536 2,210 Miscellaneous Total expense Net operating income 892 22,676 12.764 $ raw TU e a 96% 73F Clear


