Question
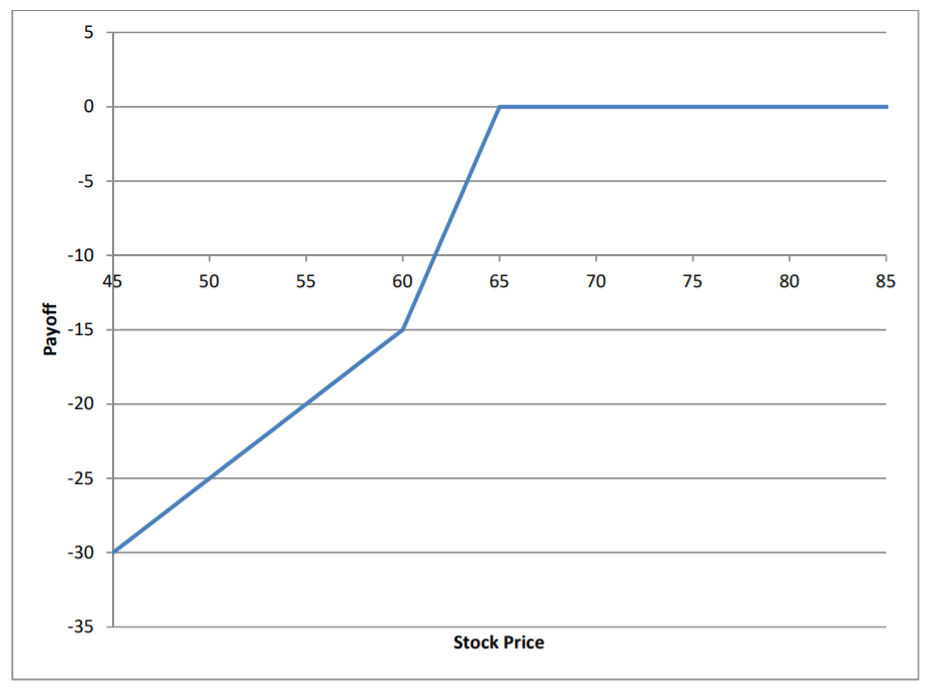
The plot below illustrates the maturity payoff (not profit/loss) of an option trading strategy. The current stock price is $65. Only put options are used
The plot below illustrates the maturity payoff (not profit/loss) of an option trading strategy. The current stock price is $65. Only put options are used in the strategy.

a) Write down the payoff of the strategy as a function of stock price at option maturity.
b) Reverse engineer the strategy and figure out what put options are used in the strategy. What are the strike prices? How many of each option are used? Long or short?
c) Use a table to write down the payoffs of each option position and the overall strategy in b) above, as a function of stock price at option maturity. Is the overall payoff identical to the one in part a) above?
5 O -5 -10 45 50 55 60 65 70 75 80 85 Payoff -15 -20 -25 -30 -35 Stock Price 5 O -5 -10 45 50 55 60 65 70 75 80 85 Payoff -15 -20 -25 -30 -35 Stock PriceStep by Step Solution
There are 3 Steps involved in it
Step: 1

Get Instant Access to Expert-Tailored Solutions
See step-by-step solutions with expert insights and AI powered tools for academic success
Step: 2

Step: 3

Ace Your Homework with AI
Get the answers you need in no time with our AI-driven, step-by-step assistance
Get Started


