Answered step by step
Verified Expert Solution
Question
1 Approved Answer
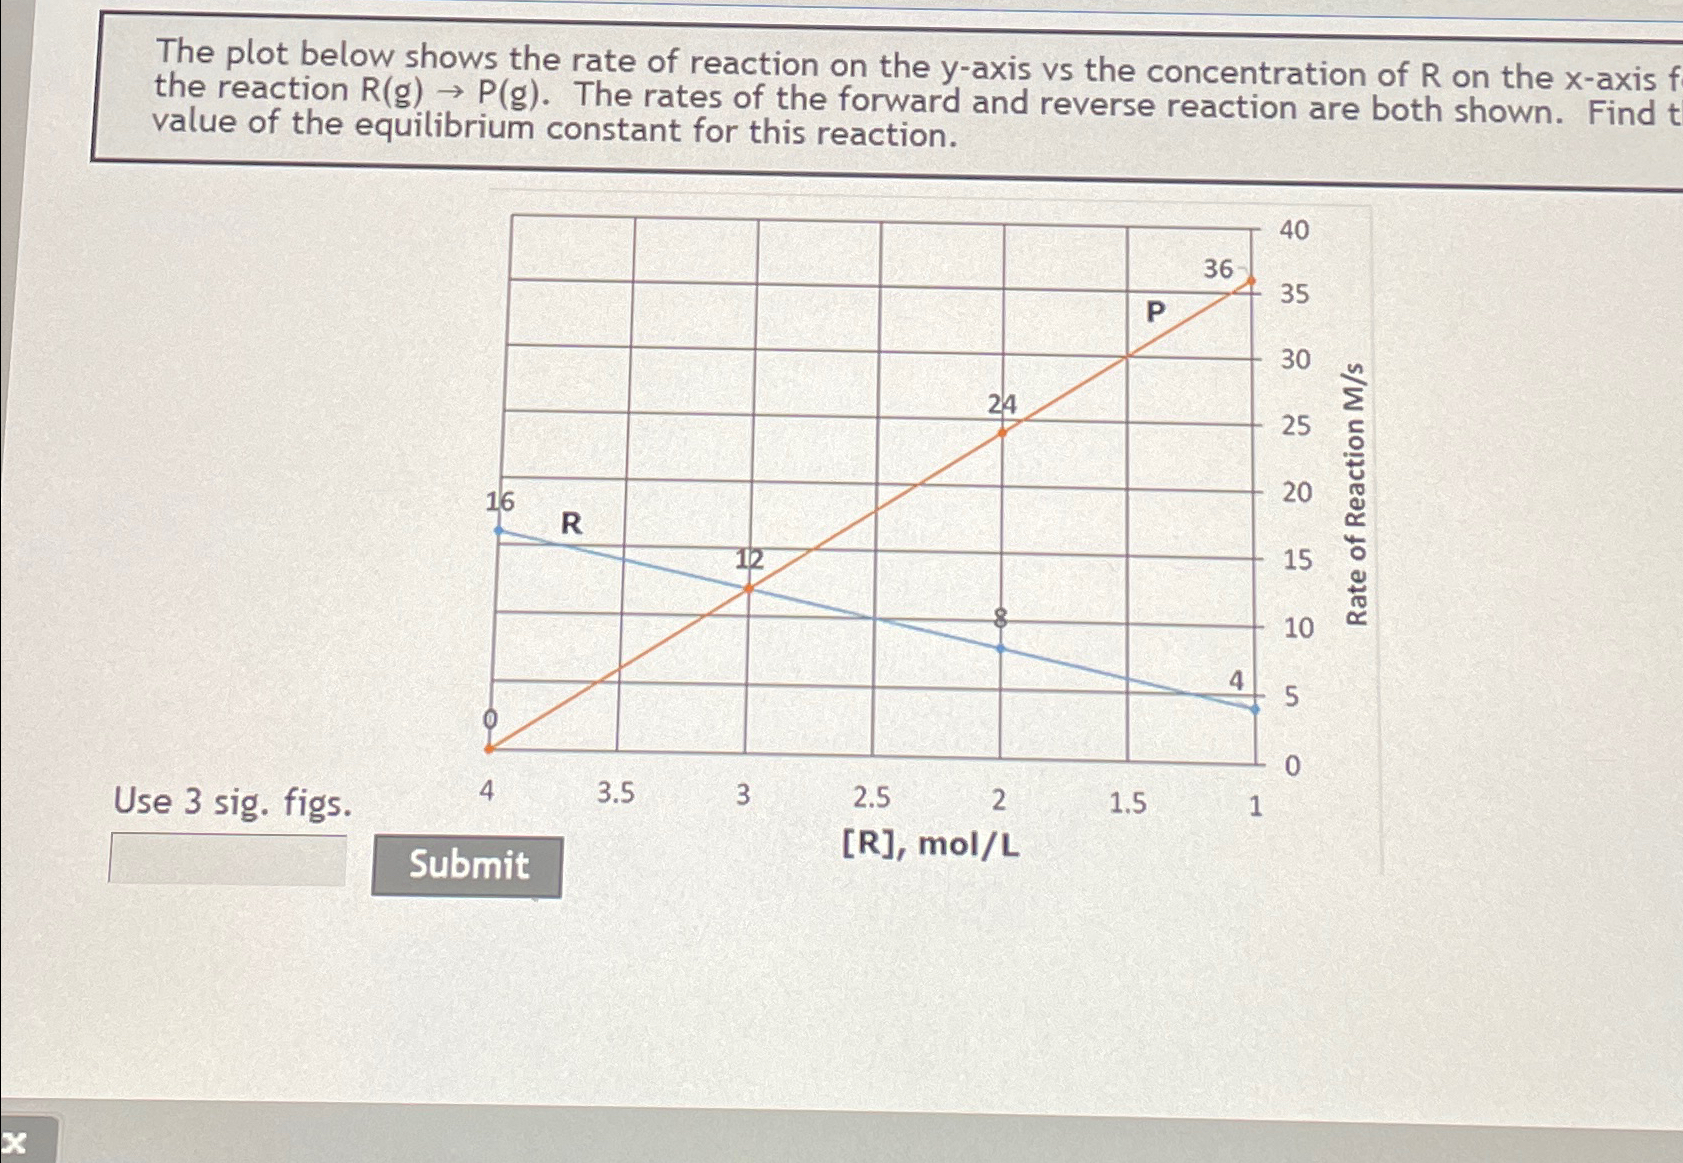
The plot below shows the rate of reaction on the y - axis v s the concentration of R on the x - axis f
The plot below shows the rate of reaction on the axis the concentration of on the axis the reaction The rates of the forward and reverse reaction are both shown. Find value of the equilibrium constant for this reaction.
Use sig. figs.
Step by Step Solution
There are 3 Steps involved in it
Step: 1

Get Instant Access to Expert-Tailored Solutions
See step-by-step solutions with expert insights and AI powered tools for academic success
Step: 2

Step: 3
Ace Your Homework with AI
Get the answers you need in no time with our AI-driven, step-by-step assistance
Get Started