

Question
The plot shows a sample of video games, available through Steam, with under 1000 players on at a time. The x-axis is the month and
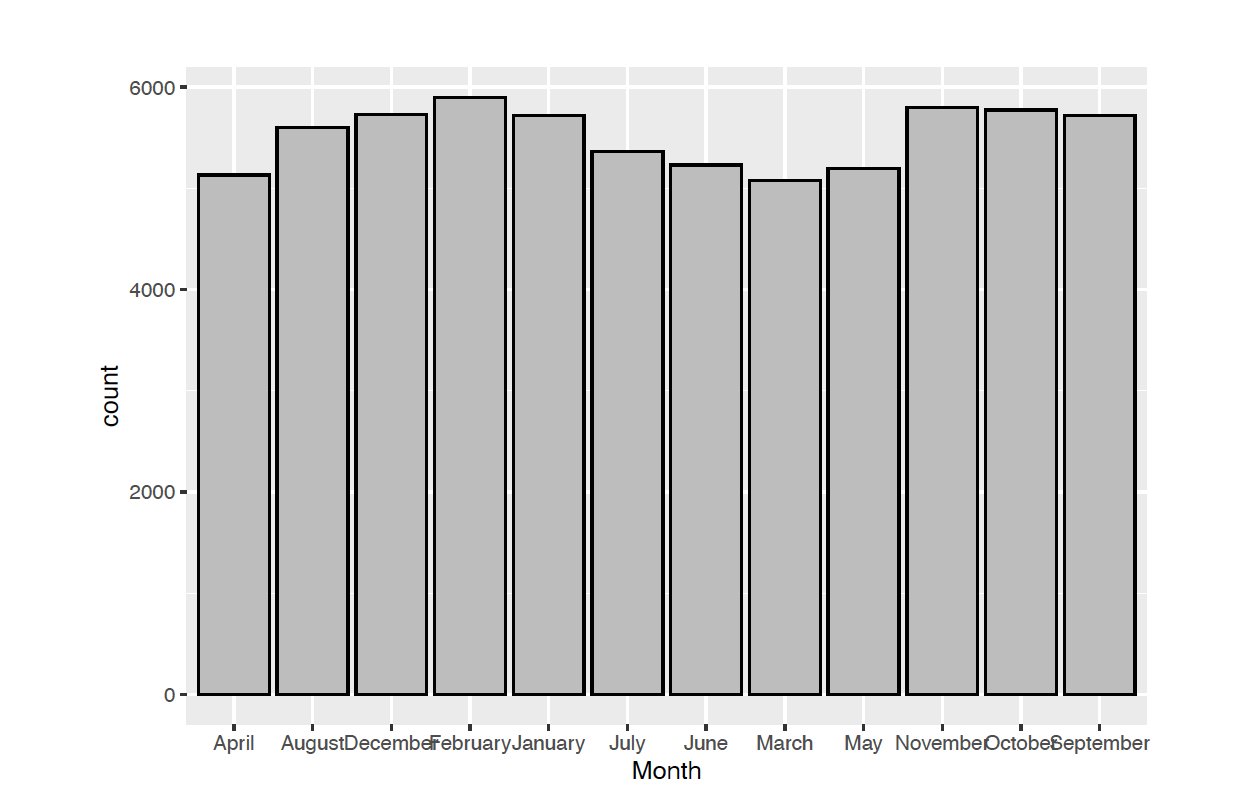
The plot shows a sample of video games, available through Steam, with under 1000 players on at a time. The x-axis is the month and the y-axis is the number of game players in each month. Describe the graph: State the type of graph, Identify what is on the x- and y-axis (if appropriate), Describe the distribution. Using the Vocabulary List
Step by Step Solution
There are 3 Steps involved in it
Step: 1

Get Instant Access to Expert-Tailored Solutions
See step-by-step solutions with expert insights and AI powered tools for academic success
Step: 2

Step: 3
Ace Your Homework with AI
Get the answers you need in no time with our AI-driven, step-by-step assistance
Get Started
College Algebra
Authors: Cynthia Y Young
4th Edition
1119320682, 9781119320685