Answered step by step
Verified Expert Solution
Question
1 Approved Answer
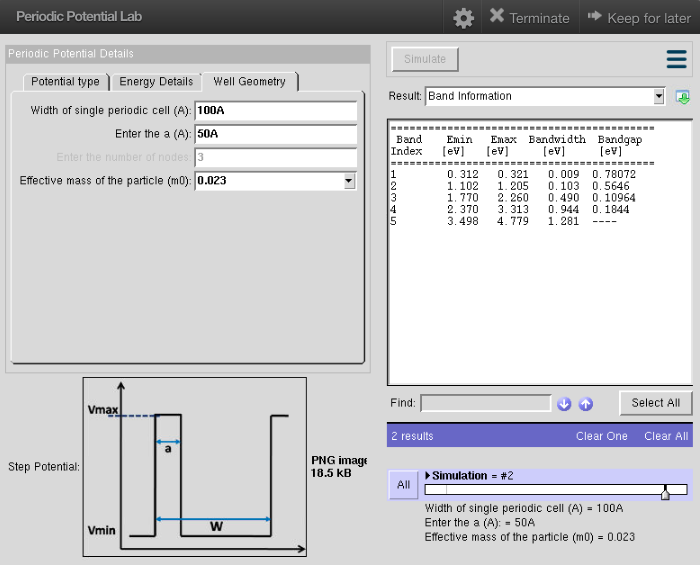
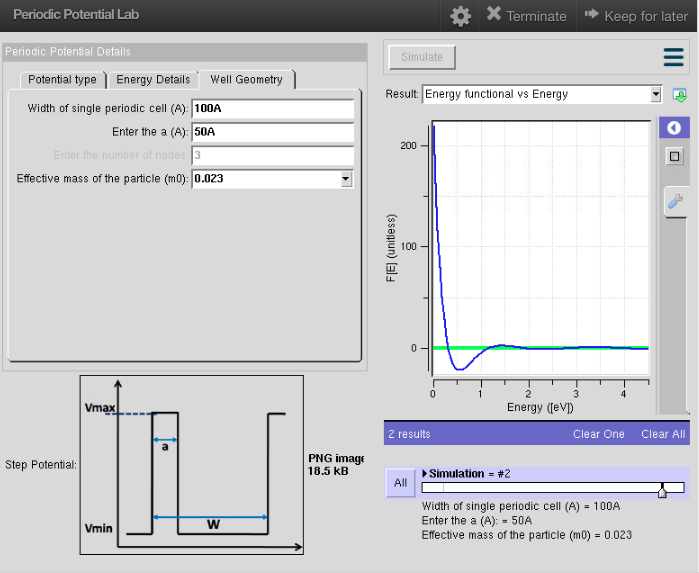
The plot will display the Energy Functional vs. Energy by default. Click the pull-down menu and go to Band Information. From the pull-down menu, now


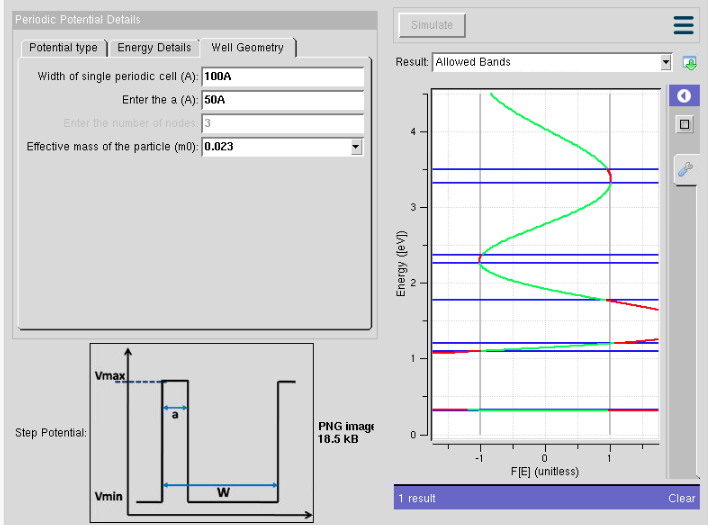
The plot will display the Energy Functional vs. Energy by default. Click the pull-down menu and go to Band Information. From the pull-down menu, now select Allowed Bands. This shows the Band Information graphically.
Looking at the Allowed Bands plot, what do the green lines and red lines represent?
From both the Band Info and Allowed Bands, you should observe in general, for higher band indices the bands get wider and the gaps get narrower. Explain why this occurs.
Periodic Potential Lab Terminate Keep for later Periodic Potential Details Simulate Potential type Energy Details Well Geometry Result: Band Information Width of single periodic cell (A): 100A Enter the a (A): 50A Band Emin Emax Bandwidth Bandgap Index [ev evl evl [ev] 0.312 0. 321 0.009 0. 78072 1.102 1.205 0.103 0.5646 1.770 2.260 0.490 0,10964 2. 370 3.313 0.944 0.1844 3.498 4. 779 .281-- Effective mass of the particle (m0): 0.023 Find Select All Vmax 2 results Clear One Clear All PNG image 18.5 kB Step Potential Simulation = #2 All Width of single periodic cell (A) 100A Enter the a (A): 50A Effective mass of the particle (m0) 0.023 Vmin Periodic Potential Lab Terminate Keep for later Periodic Potential Details Simulate Potential type Energy Details Well Geometry Result: Band Information Width of single periodic cell (A): 100A Enter the a (A): 50A Band Emin Emax Bandwidth Bandgap Index [ev evl evl [ev] 0.312 0. 321 0.009 0. 78072 1.102 1.205 0.103 0.5646 1.770 2.260 0.490 0,10964 2. 370 3.313 0.944 0.1844 3.498 4. 779 .281-- Effective mass of the particle (m0): 0.023 Find Select All Vmax 2 results Clear One Clear All PNG image 18.5 kB Step Potential Simulation = #2 All Width of single periodic cell (A) 100A Enter the a (A): 50A Effective mass of the particle (m0) 0.023 VminStep by Step Solution
There are 3 Steps involved in it
Step: 1

Get Instant Access to Expert-Tailored Solutions
See step-by-step solutions with expert insights and AI powered tools for academic success
Step: 2

Step: 3

Ace Your Homework with AI
Get the answers you need in no time with our AI-driven, step-by-step assistance
Get Started


