Answered step by step
Verified Expert Solution
Link Copied!

Question

1 Approved Answer

The plots OI V33 VS VGS W111 100K 11KB these 1n Figure 2. Each CUI'VC COITCSPOIIGS to a different value of v33. The slope of
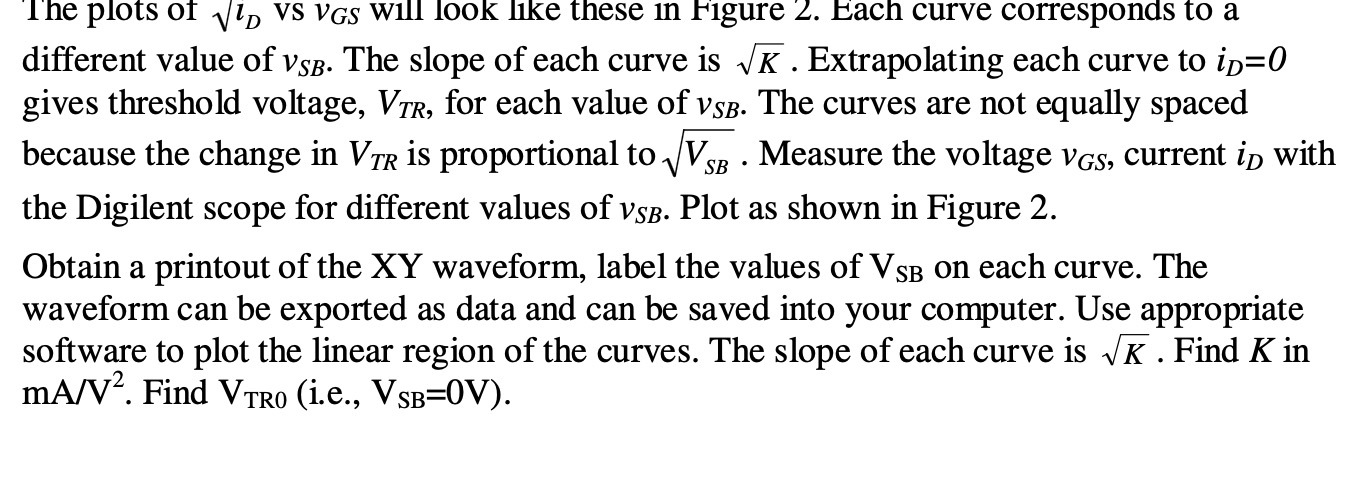
image text in transcribed
The plots OI V33 VS VGS W111 100K 11KB these 1n Figure 2. Each CUI'VC COITCSPOIIGS to a different value of v33. The slope of each curve is J? . Extrapolating each curve to iD=0 gives threshold voltage, VTR, for each value of vsg. The curves are not equally spaced because the change in VTR is proportional to 1{V33 . Measure the voltage 1263, current i}; with the Digilent scope for different values of v53. Plot as shown in Figure 2. Obtain a printout of the XY waveform, label the values of V513 on each curve. The waveform can be exported as data and can be saved into your computer. Use appropriate software to plot the linear region of the curves. The slope of each curve is J? . Find K in mA/Vz. Find VTRo (1.2., VSB=0V)

Step by Step Solution

There are 3 Steps involved in it

Step: 1

blur-text-image

Get Instant Access to Expert-Tailored Solutions

See step-by-step solutions with expert insights and AI powered tools for academic success

Step: 2

blur-text-image

Step: 3

blur-text-image

Ace Your Homework with AI

Get the answers you need in no time with our AI-driven, step-by-step assistance

Get Started

Recommended Textbook for

Macroeconomics Principles Applications And Tools

Authors: Arthur O Sullivan, Steven M. Sheffrin, Stephen J. Perez

7th Edition

978-0134089034, 9780134062754, 134089030, 134062752, 978-0132555234

More Books

Students also viewed these Economics questions