Question
The population growth over time (measured in seconds) of a particular bacteria is displayed in the following graph. a. How many bacteria are alive

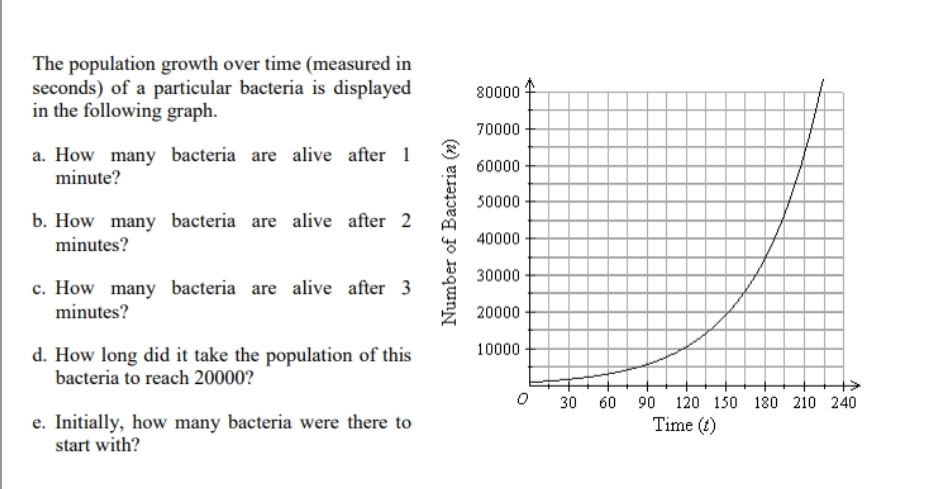
The population growth over time (measured in seconds) of a particular bacteria is displayed in the following graph. a. How many bacteria are alive after 1 minute? b. How many bacteria are alive after 2 minutes? c. How many bacteria are alive after 3 minutes? d. How long did it take the population of this bacteria to reach 20000? e. Initially, how many bacteria were there to start with? Number of Bacteria (n) 80000 70000 60000 50000 40000 30000 20000 10000 0 30 60 90 120 150 180 210 240 Time (t)
Step by Step Solution
There are 3 Steps involved in it
Step: 1

Get Instant Access to Expert-Tailored Solutions
See step-by-step solutions with expert insights and AI powered tools for academic success
Step: 2

Step: 3

Ace Your Homework with AI
Get the answers you need in no time with our AI-driven, step-by-step assistance
Get StartedRecommended Textbook for
Structural Analysis
Authors: Russell Hibbeler
10th Edition
134610679, 978-0134610672
Students also viewed these Mathematics questions
Question
Answered: 1 week ago
Question
Answered: 1 week ago
Question
Answered: 1 week ago
Question
Answered: 1 week ago
Question
Answered: 1 week ago
Question
Answered: 1 week ago
Question
Answered: 1 week ago
Question
Answered: 1 week ago
Question
Answered: 1 week ago
Question
Answered: 1 week ago
Question
Answered: 1 week ago
Question
Answered: 1 week ago
Question
Answered: 1 week ago
Question
Answered: 1 week ago
Question
Answered: 1 week ago
Question
Answered: 1 week ago
Question
Answered: 1 week ago
Question
Answered: 1 week ago
Question
Answered: 1 week ago
Question
Answered: 1 week ago
Question
Answered: 1 week ago
Question
Answered: 1 week ago
Question
Answered: 1 week ago
View Answer in SolutionInn App


