

Answered step by step
Verified Expert Solution
Question
1 Approved Answer
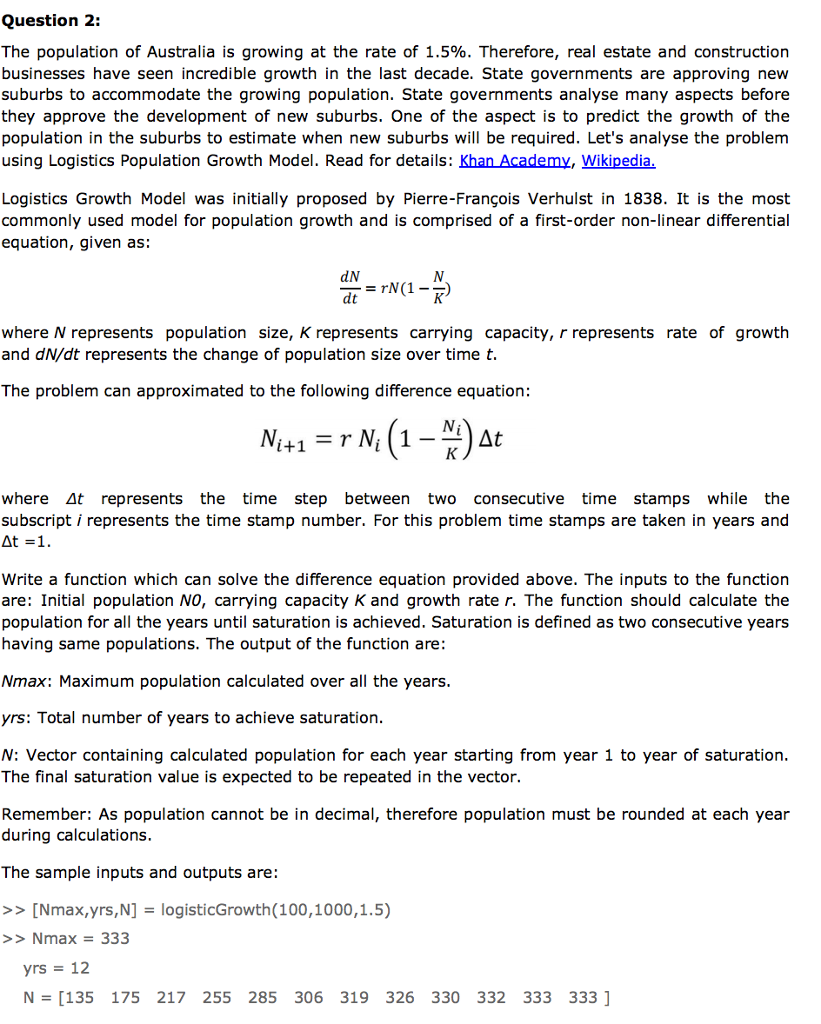
The population of Australia is growing at the rate of 1.5%. Therefore, real estate and construction businesses have seen incredible growth in the last decade.
Step by Step Solution
There are 3 Steps involved in it
Step: 1

Get Instant Access to Expert-Tailored Solutions
See step-by-step solutions with expert insights and AI powered tools for academic success
Step: 2

Step: 3
Ace Your Homework with AI
Get the answers you need in no time with our AI-driven, step-by-step assistance
Get Started
Database Driven Web Sites
Authors: Joline Morrison, Mike Morrison
2nd Edition
? 061906448X, 978-0619064488