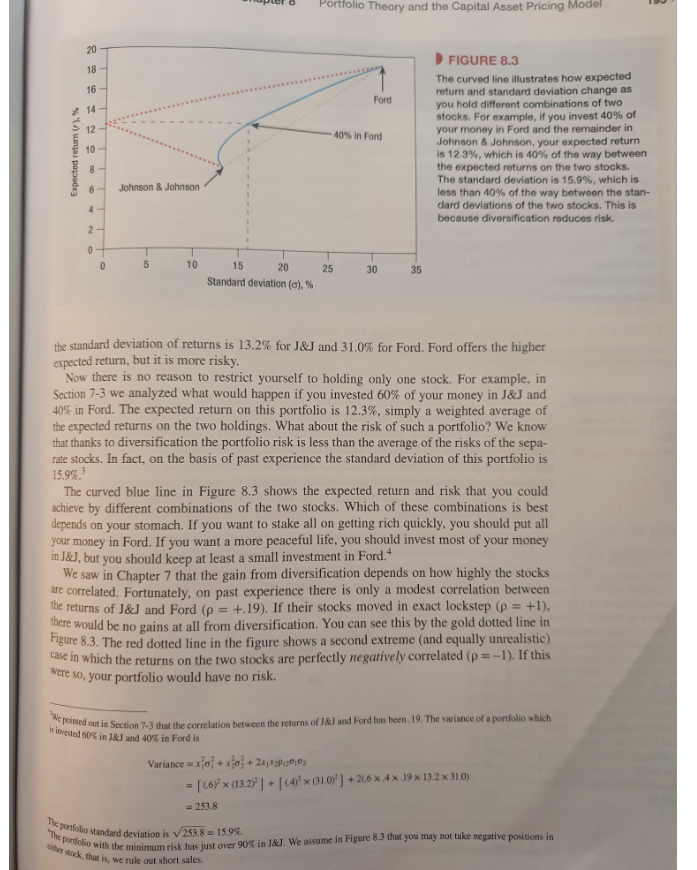
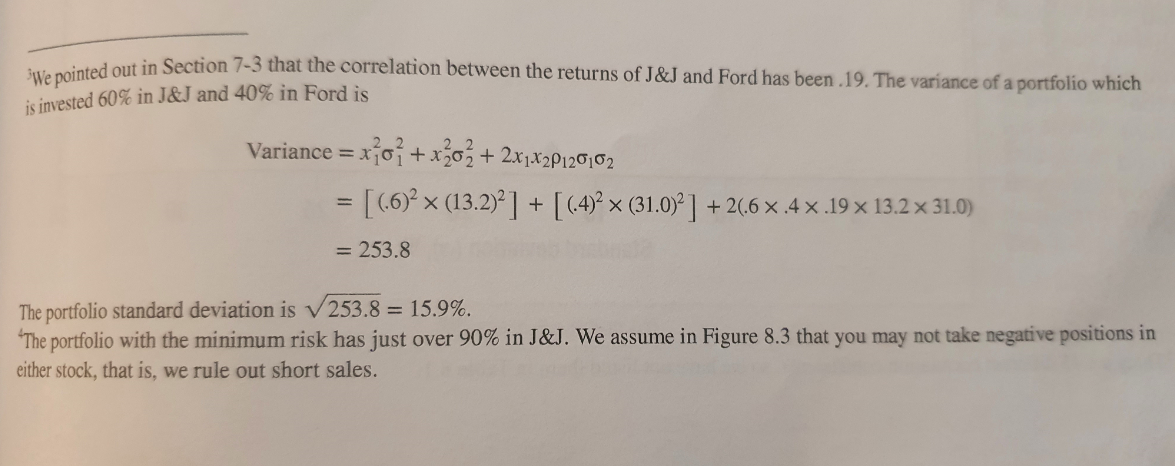
The portfolio Standard deviation is V 253.8 = 159 "portolio with the minimum risk has just over 90% in J&. We assume in Figure 8.3 that you may not take negative positions in het stack, that is, we rule out short sales Portfolio Theory and the Capital Asset Pricing Model 20 18 16 Ford 14 12 40% in Ford Expected return ir).% FIGURE 8.3 The curved line illustrates how expected return and standard deviation change as you hold different combinations of two stocks. For example, if you invest 40% of your money in Ford and the remainder in Johnson & Johnson, your expected return is 12.3%, which is 40% of the way between the expected returns on the two stocks. The standard deviation is 15.9%, which is less than 40% of the way between the stan- dard deviations of the two stocks. This is because diversification reduces risk. 10 8- 6 Johnson & Johnson 2 0 0 5 10 25 30 35 15 20 Standard deviation (a),% the standard deviation of returns is 13.2% for J&J and 31.0% for Ford. Ford offers the higher expected return, but it is more risky. Now there is no reason to restrict yourself to holding only one stock. For example, in Section 7-3 we analyzed what would happen if you invested 60% of your money in J&J and 40% in Ford. The expected return on this portfolio is 12.3%, simply a weighted average of the expected returns on the two holdings. What about the risk of such a portfolio? We know that thanks to diversification the portfolio risk is less than the average of the risks of the sepa- rate stocks. In fact, on the basis of past experience the standard deviation of this portfolio is 15.9%. The curved blue line in Figure 8.3 shows the expected return and risk that you could achieve by different combinations of the two stocks. Which of these combinations is best depends on your stomach. If you want to stake all on getting rich quickly, you should put all your money in Ford. If you want a more peaceful life, you should invest most of your money in J&J, but you should keep at least a small investment in Ford. We saw in Chapter 7 that the gain from diversification depends on how highly the stocks are correlated. Fortunately, on past experience there is only a modest correlation between the returns of J&J and Ford (p = +.19). If their stocks moved in exact lockstep (p = +1), there would be no gains at all from diversification. You can see this by the gold dotted line in Figure 8.3. The red dotted line in the figure shows a second extreme (and equally unrealistie) case in which the returns on the two stocks are perfectly negatively correlated (p=-1). If this were so, your portfolio would have no risk. e pointed out in Section 7-3 that the correlation berween the returns of JR) and Ford has been.19. The variance of a portfolio which is invested 60% in J&J and 40% in Ford is Variance = xo +230 +24122130102 = [(-6) x (13.2))] + [64)x 01009) +206 x 4x.19x 13.2 x 310) = 253.8 We pointed out in Section 7-3 that the correlation between the returns of J&J and Ford has been .19. The variance of a portfolio which is invested 60% in J&J and 40% in Ford is Variance = xo? +xzo+ 2xjX2P120102 = [(6)2 x (13.2)2] + [(14)2 x (31.0)2] + 26.6 x.4x.19 x 13.2 x 31.0) = 253.8 The portfolio standard deviation is V253.8 = 15.9%. The portfolio with the minimum risk has just over 90% in J&J. We assume in Figure 8.3 that you may not take negative positions in either stock, that is, we rule out short sales. Minimum-risk portfolio In footnote 4 we noted that the minimum-risk portfolio contained an investment of 90.2% in Johnson & Johnson and 9.8% in Ford. Prove it. (Hint: You need a little calculus to do so.)