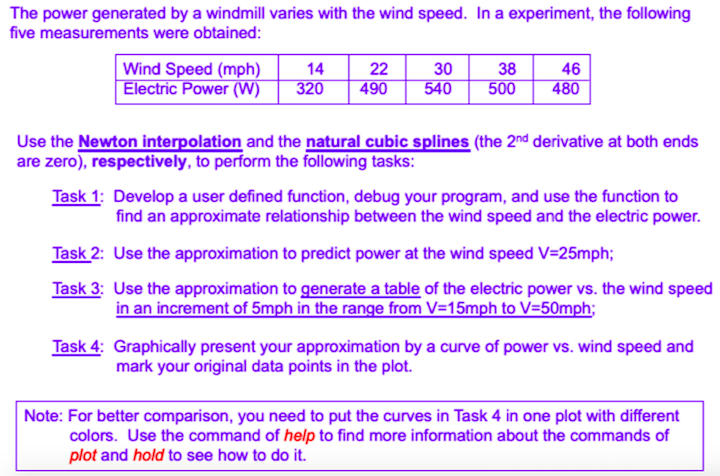
The power generated by a windmill varies with the wind speed. In a experiment, the following five measurements were obtained: Wind Speed (mph) 14 22 30 38 46 Electric Power (W) 320 490 540 500 480 Use the Newton interpolation and the natural cubic splines (the 2nd derivative at both ends are zero), respectively, to perform the following tasks: Task 1: Develop a user defined function, debug your program, and use the function to find an approximate relationship between the wind speed and the electric power. Task 2: Use the approximation to predict power at the wind speed V=25mph; Task 3: Use the approximation to generate a table of the electric power vs. the wind speed in an increment of 5mph in the range from V=15mph to V=50mph; Task 4: Graphically present your approximation by a curve of power vs. wind speed and mark your original data points in the plot. Note: For better comparison, you need to put the curves in Task 4 in one plot with different colors. Use the command of help to find more information about the commands of plot and hold to see how to do it. The power generated by a windmill varies with the wind speed. In a experiment, the following five measurements were obtained: Wind Speed (mph) 14 22 30 38 46 Electric Power (W) 320 490 540 500 480 Use the Newton interpolation and the natural cubic splines (the 2nd derivative at both ends are zero), respectively, to perform the following tasks: Task 1: Develop a user defined function, debug your program, and use the function to find an approximate relationship between the wind speed and the electric power. Task 2: Use the approximation to predict power at the wind speed V=25mph; Task 3: Use the approximation to generate a table of the electric power vs. the wind speed in an increment of 5mph in the range from V=15mph to V=50mph; Task 4: Graphically present your approximation by a curve of power vs. wind speed and mark your original data points in the plot. Note: For better comparison, you need to put the curves in Task 4 in one plot with different colors. Use the command of help to find more information about the commands of plot and hold to see how to do it