Answered step by step
Verified Expert Solution
Link Copied!

Question

1 Approved Answer

The power output of a wind turbine can be approximated as follows: P = 0.5 xi rho AV^3 where xi is an efficiency factor, rho
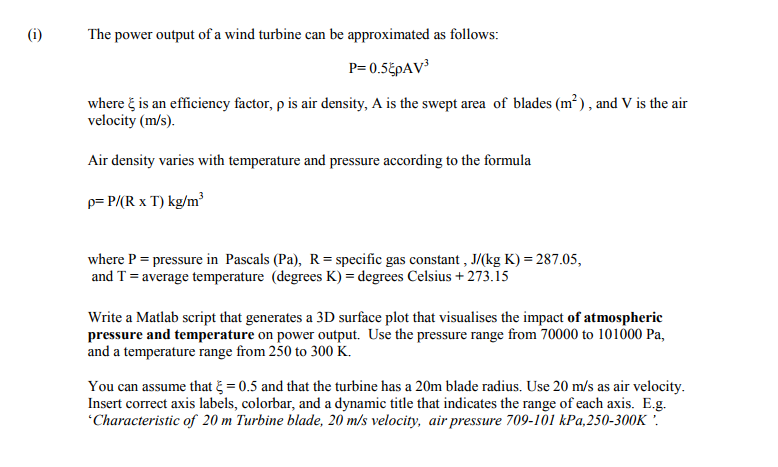
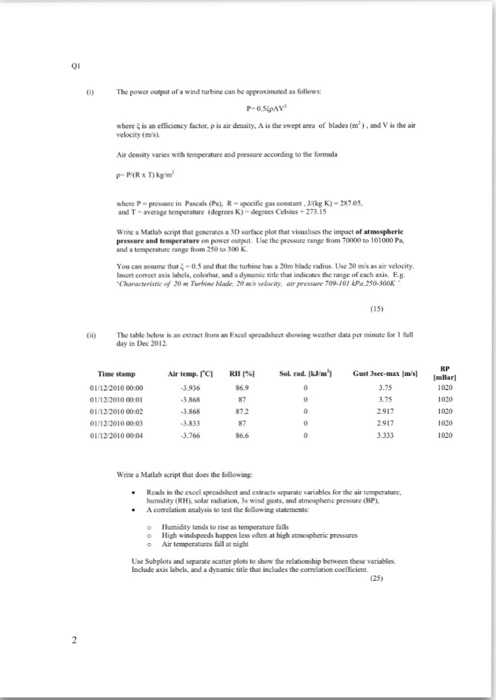
image text in transcribed image text in transcribed

The power output of a wind turbine can be approximated as follows: P = 0.5 xi rho AV^3 where xi is an efficiency factor, rho is air density, A is the swept area of blades (m^2), and V is the air velocity (m/s). Air density varies with temperature and pressure according to the formula rho = P/(R times T) kg/m^3 where P = pressure in Pascals (Pa), R = specific gas constant, J/(kg K) = 287.05, and T = average temperature (degrees K) = degrees Celsius + 273.15 Write a Matlab script that generates a 3D surface plot that visualises the impact of atmospheric pressure and temperature on power output. Use the pressure range from 70000 to 101000 Pa, and a temperature range from 250 to 300 K. You can assume that xi = 0.5 and that the turbine has a 20m blade radius. Use 20 m/s as air velocity. Insert correct axis labels, colorbar, and a dynamic title that indicates the range of each axis. E.g. "Characteristic of 20 m Turbine blade, 20 m/s velocity, air pressure 709-101 kPa, 250-300K'. The power output of a wind turbine can be approximated as follows: P = 0.5 xi rho AV^3 where xi is an efficiency factor, rho is air density, A is the swept area of blades (m^2), and V is the air velocity (m/s). Air density varies with temperature and pressure according to the formula rho = P/(R times T) kg/m^3 where P = pressure in Pascals (Pa), R = specific gas constant, J/(kg K) = 287.05, and T = average temperature (degrees K) = degrees Celsius + 273.15 Write a Matlab script that generates a 3D surface plot that visualises the impact of atmospheric pressure and temperature on power output. Use the pressure range from 70000 to 101000 Pa, and a temperature range from 250 to 300 K. You can assume that xi = 0.5 and that the turbine has a 20m blade radius. Use 20 m/s as air velocity. Insert correct axis labels, colorbar, and a dynamic title that indicates the range of each axis. E.g. "Characteristic of 20 m Turbine blade, 20 m/s velocity, air pressure 709-101 kPa, 250-300K

Step by Step Solution

There are 3 Steps involved in it

Step: 1

blur-text-image

Get Instant Access to Expert-Tailored Solutions

See step-by-step solutions with expert insights and AI powered tools for academic success

Step: 2

blur-text-image_2

Step: 3

blur-text-image_3

Ace Your Homework with AI

Get the answers you need in no time with our AI-driven, step-by-step assistance

Get Started

Recommended Textbook for

Databases DeMYSTiFieD

Authors: Andy Oppel

2nd Edition

0071747990, 978-0071747998

More Books

Students also viewed these Databases questions

Question

What do Dimensions represent in OLAP Cubes?

Answered: 1 week ago