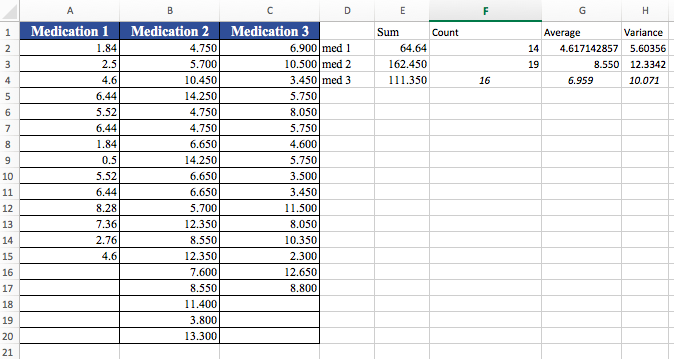
The present study shows data for the weight lost by people who have been taking medications to treat overweight and obesity for the last three months. A nutrition researcher is interested in knowing if there is a significant difference in weight loss that results from three FDA approved medications to treat overweight and obesity. The nutrition researcher records data for people who have been taking the medications for the last three months and have not been on any diets.We will use the Excel Data Analysis Add-in to find the average weight loss for each of the medications, the sum of squares between groups, within groups and the total sum of squares. We will also find the mean sum of squares between groups, within groups and the total sum of squares. We will perform a hypothesis test to test if the average weight loss is the same. We will compare the test statistic with a critical value(s) and decide if we should reject or not reject the null hypothesis. We will use different alpha levels to test the hypothesis. We will find the observed level of significance and use it to make conclusions about the claim. We will identify possible errors made. Assume that the distribution of the weight loss for the three populations is normal and the samples are randomly selected.
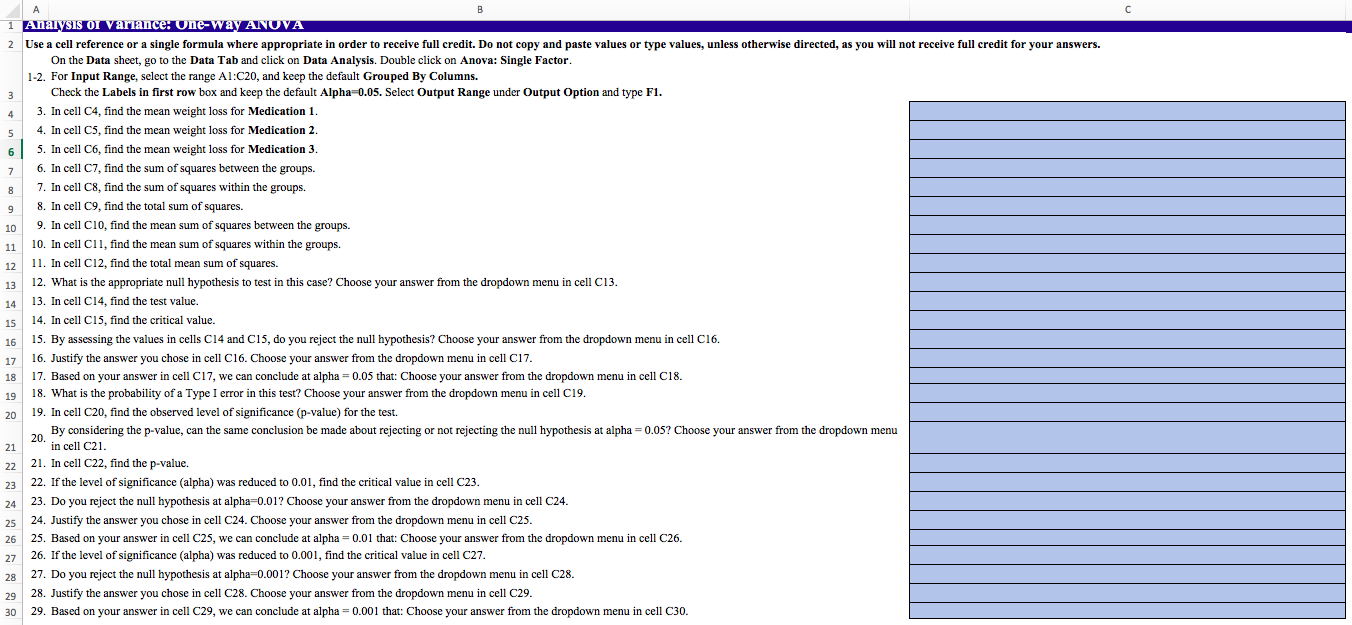
A B C Analysis of variance: One-Way ANOVA 2 Use a cell reference or a single formula where appropriate in order to receive full credit. Do not copy and paste values or type values, unless otherwise directed, as you will not receive full credit for your answers. On the Data sheet, go to the Data Tab and click on Data Analysis. Double click on Anova: Single Factor. 1-2. For Input Range, select the range Al:C20, and keep the default Grouped By Columns. Check the Labels in first row box and keep the default Alpha=0.05. Select Output Range under Output Option and type F1. 3. In cell C4, find the mean weight loss for Medication 1. 4. In cell C5, find the mean weight loss for Medication 2. 5. In cell C6, find the mean weight loss for Medication 3. 6. In cell C7, find the sum of squares between the groups. 7. In cell C8, find the sum of squares within the groups. LD CO 8. In cell C9, find the total sum of squares. 10 9. In cell C10, find the mean sum of squares between the groups. 11 10. In cell Cl 1, find the mean sum of squares within the groups. 12 11. In cell C12, find the total mean sum of squares. 13 12. What is the appropriate null hypothesis to test in this case? Choose your answer from the dropdown menu in cell C13. 14 13. In cell C14, find the test value. 15 14. In cell C15, find the critical value. 16 15. By assessing the values in cells C14 and C15, do you reject the null hypothesis? Choose your answer from the dropdown menu in cell C16. 17 16. Justify the answer you chose in cell C16. Choose your answer from the dropdown menu in cell C17. 18 17. Based on your answer in cell C17, we can conclude at alpha = 0.05 that: Choose your answer from the dropdown menu in cell C18. 19 18. What is the probability of a Type I error in this test? Choose your answer from the dropdown menu in cell C19. 20 19. In cell C20, find the observed level of significance (p-value) for the test. By considering the p-value, can the same conclusion be made about rejecting or not rejecting the null hypothesis at alpha = 0.05? Choose your answer from the dropdown menu 20. 21 in cell C21. 22 21. In cell C22, find the p-value. 22. If the level of significance (alpha) was reduced to 0.01, find the critical value in cell C23. 24 23. Do you reject the null hypothesis at alpha=0.01? Choose your answer from the dropdown menu in cell C24. 25 24. Justify the answer you chose in cell C24. Choose your answer from the dropdown menu in cell C25. 26 25. Based on your answer in cell C25, we can conclude at alpha = 0.01 that: Choose your answer from the dropdown menu in cell C26. 27 26. If the level of significance (alpha) was reduced to 0.001, find the critical value in cell C27. 28 27. Do you reject the null hypothesis at alpha=0.001? Choose your answer from the dropdown menu in cell C28. 29 28. Justify the answer you chose in cell C28. Choose your answer from the dropdown menu in cell C29. 30 29. Based on your answer in cell C29, we can conclude at alpha = 0.001 that: Choose your answer from the dropdown menu in cell C30.A B C D E F G H Medication 1 Medication 2 Medication 3 Sum Count Average Variance 1.84 4.750 6.900 med 1 64.64 14 4.617142857 5.60356 2.5 5.700 10.500 med 2 162.450 19 8.550 12.3342 4.6 10.450 3.450 med 3 111.350 16 6.959 10.071 6.44 14.250 5.750 5.52 4.750 8.050 6.44 4.750 5.750 1.84 6.650 4.600 LD 0.5 14.250 5.750 10 5.52 6.650 3.500 11 6.44 6.650 3.450 12 8.28 5.700 11.500 13 7.36 12.350 8.050 14 2.76 8.550 10.350 15 4.6 12.350 2.300 16 7.600 12.650 17 8.550 8.800 18 11.400 19 3.800 20 13.300 21


