Answered step by step
Verified Expert Solution
Question
1 Approved Answer
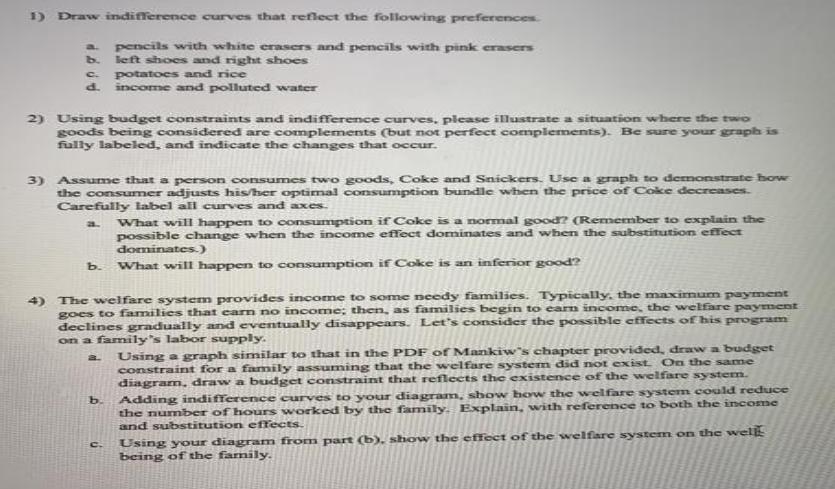
1) Draw indifference a. pencils with white erasers and pencils with pink erasers b. left shoes and right shoes c. potatoes and rice d.


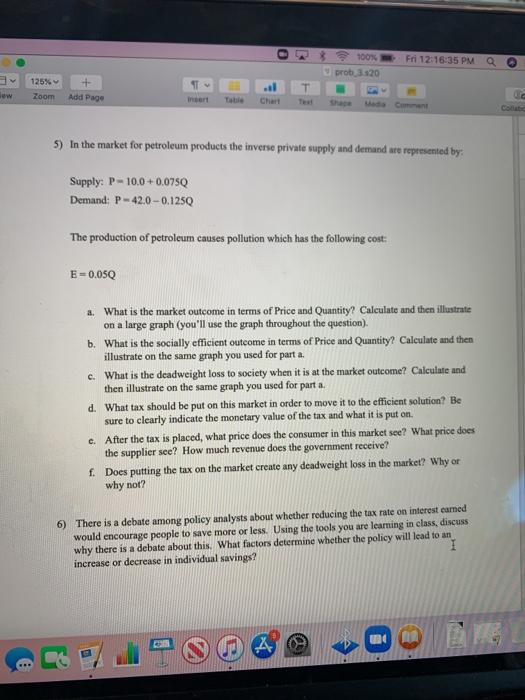
1) Draw indifference a. pencils with white erasers and pencils with pink erasers b. left shoes and right shoes c. potatoes and rice d. income and polluted water cur curves that reflect the following preferences. 2) Using budget constraints and indifference curves, please illustrate a situation where the two goods being considered are complements (but not perfect complements). Be sure your graph is fully labeled, and indicate the changes that occur. 3) Assume that a person consumes two goods, Coke and Snickers. Use a graph to demonstrate how the consumer adjusts his/her optimal consumption bundle when the price of Coke decreases. Carefully label all curves and axes. a. What will happen to consumption if Coke is a normal good? (Remember to explain the possible change when the income effect dominates and when the substitution effect dominates.) What will happen to consumption if Coke is an inferior good? b. 4) The welfare system provides income to some needy families. Typically, the maximum payment goes to families that earn no income; then, as families begin to earn income, the welfare payment declines gradually and eventually disappears. Let's consider the possible effects of his program on a family's labor supply. a. Using a graph similar to that in the PDF of Mankiw's chapter provided, draw a budget constraint for a family assuming that the welfare system did not exist. On the same diagram, draw a budget constraint that reflects the existence of the welfare system. b. C. Adding indifference curves to your diagram, show how the welfare system could reduce the number of hours worked by the family. Explain, with reference to both the income and substitution effects. Using your diagram from part (b). show the effect of the welfare system on the well- being of the family. New 125% + Zoom Add Page Insert Supply: P-10.0+0.075Q Demand: P-42.0-0.125Q 0 E-0.050 Chart Text 100% prob 3.520 5) In the market for petroleum products the inverse private supply and demand are represented by: Fri 12:16:35 PM a Media Comment The production of petroleum causes pollution which has the following cost: a. What is the market outcome in terms of Price and Quantity? Calculate and then illustrate on a large graph (you'll use the graph throughout the question). b. What is the socially efficient outcome in terms of Price and Quantity? Calculate and then illustrate on the same graph you used for part a. c. What is the deadweight loss to society when it is at the market outcome? Calculate and then illustrate on the same graph you used for part a. d. What tax should be put on this market in order to move it to the efficient solution? Be sure to clearly indicate the monetary value of the tax and what it is put on. e. After the tax is placed, what price does the consumer in this market see? What price does the supplier see? How much revenue does the government receive? f. Does putting the tax on the market create any deadweight loss in the market? Why or why not? 6) There is a debate among policy analysts about whether reducing the tax rate on interest earned would encourage people to save more or less. Using the tools you are learning in class, discuss why there is a debate about this. What factors determine whether the policy will lead to an increase or decrease in individual savings? Ca Collatio
Step by Step Solution
★★★★★
3.36 Rating (152 Votes )
There are 3 Steps involved in it
Step: 1
1 a Indifference curves for pencils with white erasers and pink erasers The indifference curves reflect the preferences of the individual for pencils with white erasers and pencils with pink erasers T...
Get Instant Access to Expert-Tailored Solutions
See step-by-step solutions with expert insights and AI powered tools for academic success
Step: 2

Step: 3

Ace Your Homework with AI
Get the answers you need in no time with our AI-driven, step-by-step assistance
Get Started


