Answered step by step
Verified Expert Solution
Question
1 Approved Answer
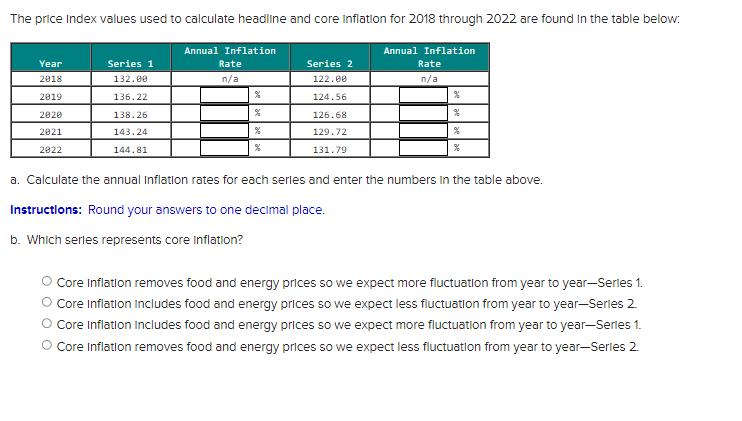
The price Index values used to calculate headline and core Inflation for 2018 through 2022 are found in the table below: Year 2018 2019

The price Index values used to calculate headline and core Inflation for 2018 through 2022 are found in the table below: Year 2018 2019 2820 2021 2822 Series 1 132.00 136.22 138.26 143.24 144.81 Annual Inflation Rate n/a % % % % Series 2 122.00 124.56 126.68 129.72 131.791 Annual Inflation Rate n/a % % a. Calculate the annual Inflation rates for each series and enter the numbers in the table above. Instructions: Round your answers to one decimal place. b. Which series represents core Inflation? Core Inflation removes food and energy prices so we expect more fluctuation from year to year-Series 1. Core Inflation includes food and energy prices so we expect less fluctuation from year to year-Series 2 Core Inflation includes food and energy prices so we expect more fluctuation from year to year-Series 1. O Core Inflation removes food and energy prices so we expect less fluctuation from year to year-Series 2.
Step by Step Solution
★★★★★
3.38 Rating (157 Votes )
There are 3 Steps involved in it
Step: 1
a Calculate the annual inflation rates for each series For Series 1 Annual Inflation Rate for 2018 ...
Get Instant Access to Expert-Tailored Solutions
See step-by-step solutions with expert insights and AI powered tools for academic success
Step: 2

Step: 3

Ace Your Homework with AI
Get the answers you need in no time with our AI-driven, step-by-step assistance
Get Started


