Answered step by step
Verified Expert Solution
Question
1 Approved Answer
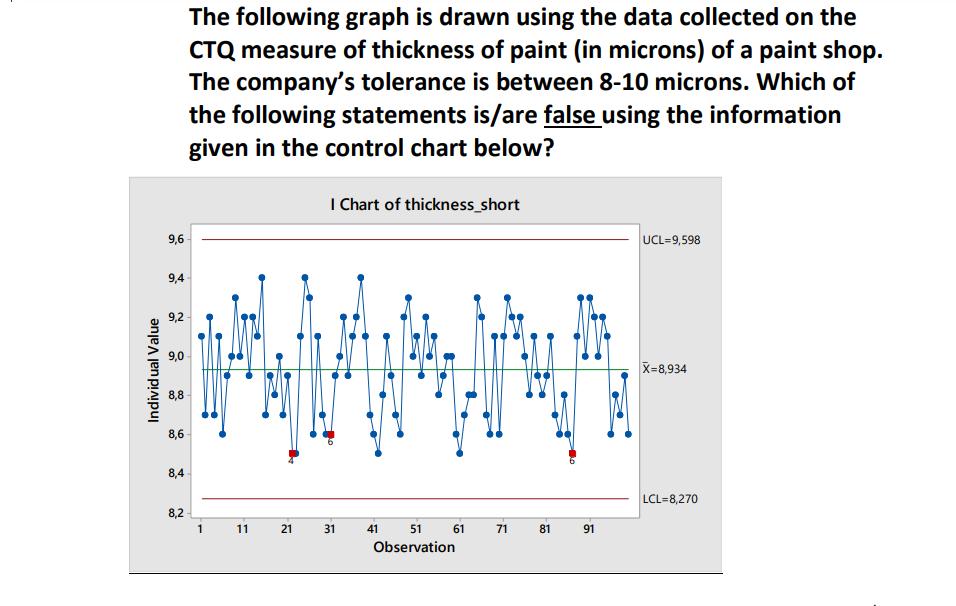
Individual Value 9,6 9,4 9,2 9,0 8,8 8,6 8,4 8,2 The following graph is drawn using the data collected on the CTQ measure of


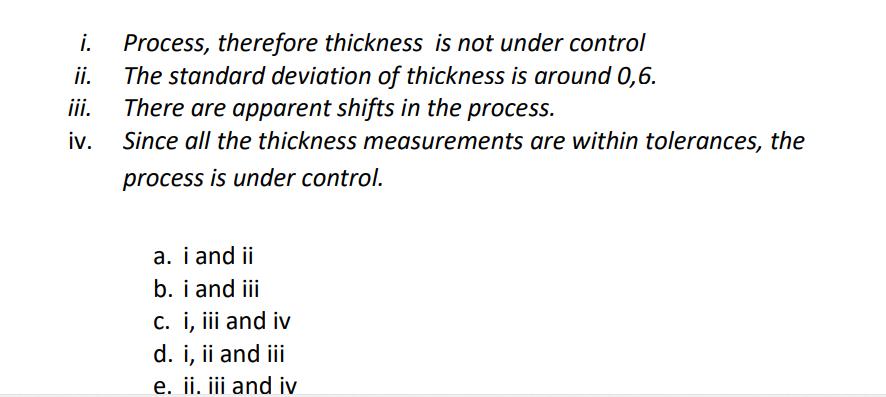
Individual Value 9,6 9,4 9,2 9,0 8,8 8,6 8,4 8,2 The following graph is drawn using the data collected on the CTQ measure of thickness of paint (in microns) of a paint shop. The company's tolerance is between 8-10 microns. Which of the following statements is/are false using the information given in the control chart below? 1 11 21 I Chart of thickness_short 31 41 51 Observation 61 71 81 91 UCL-9,598 X=8,934 LCL=8,270 ii. i. Process, therefore thickness is not under control The standard deviation of thickness is around 0,6. There are apparent shifts in the process. iii. iv. Since all the thickness measurements are within tolerances, the process is under control. a. i and ii b. i and iii c. i, iii and iv d. i, ii and iii e. ii. iii and iv
Step by Step Solution
★★★★★
3.40 Rating (150 Votes )
There are 3 Steps involved in it
Step: 1
The detailed answer for the above question is provided below Answer d i ...
Get Instant Access to Expert-Tailored Solutions
See step-by-step solutions with expert insights and AI powered tools for academic success
Step: 2

Step: 3

Ace Your Homework with AI
Get the answers you need in no time with our AI-driven, step-by-step assistance
Get Started


