

Question
The price per share, prior years earning per share, the dividend paid were recorded for a random sample of 100 firms whose stocks traded on
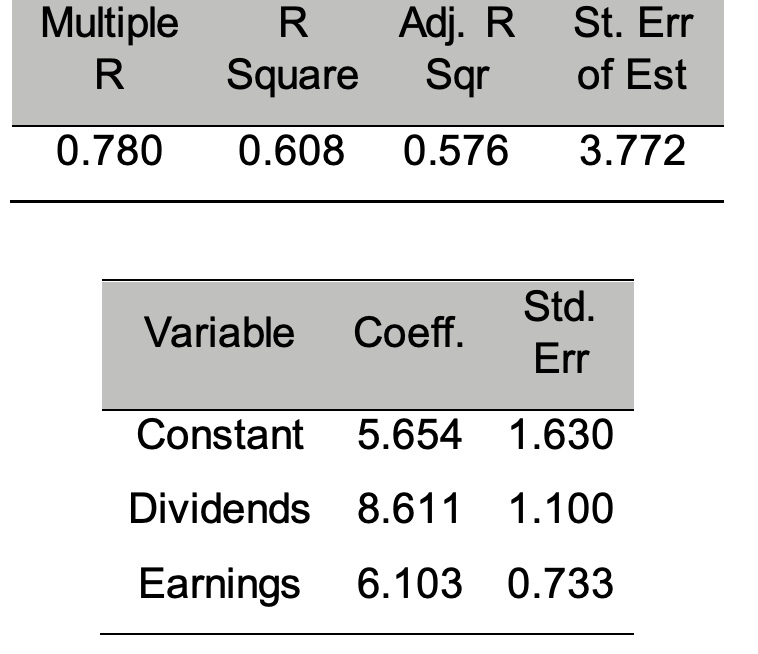
The price per share, prior years earning per share, the dividend paid were recorded for a random sample of 100 firms whose stocks traded on the NYSE. A multivariate regression of PRICE on earning and dividends yielded the following output:
(a)Write down the estimated regression equation, and interpret the model. [2 MARKS]
(b) What is the value of R-Square? Explain the meaning of this value. [2 MARKS]
(c) Test separately if Dividends and Earnings have a significant impact on the Price per Share at the =0.01 level. Write down the hypotheses you are testing, the statistic you use to evaluate the test, and your conclusion. [4 MARKS}
d) ) A firms current dividend paid is 1 and earning per share is 2.
(i) What is its expected price per share? [2 MARKS]
(ii) For the firm in part (d), what is the 95% prediction interval for its price per share? [2 MARKS]
e) A firm is faced with the decision of whether or not to increase its dividend by 0.05, thus holding earnings fixed, or decrease its dividend by 0.20, which would have the effect of increasing earnings by 0.30. If the firms aim is to maximize this expected share price, which alternative should it choose based on the results of this model?
Multiple R R. Adj. R Square Sqr St. Err of Est 0.780 0.608 0.576 3.772 Variable Coeff. Std. Err Constant 5.654 1.630 Dividends 8.611 1.100 Earnings 6.103 0.733 Multiple R R. Adj. R Square Sqr St. Err of Est 0.780 0.608 0.576 3.772 Variable Coeff. Std. Err Constant 5.654 1.630 Dividends 8.611 1.100 Earnings 6.103 0.733Step by Step Solution
There are 3 Steps involved in it
Step: 1

Get Instant Access to Expert-Tailored Solutions
See step-by-step solutions with expert insights and AI powered tools for academic success
Step: 2

Step: 3
Ace Your Homework with AI
Get the answers you need in no time with our AI-driven, step-by-step assistance
Get Started
The Geography Of Finance
Authors: Gordon L. Clark, Darius Wójcik
1st Edition
0199213364, 978-0199213368