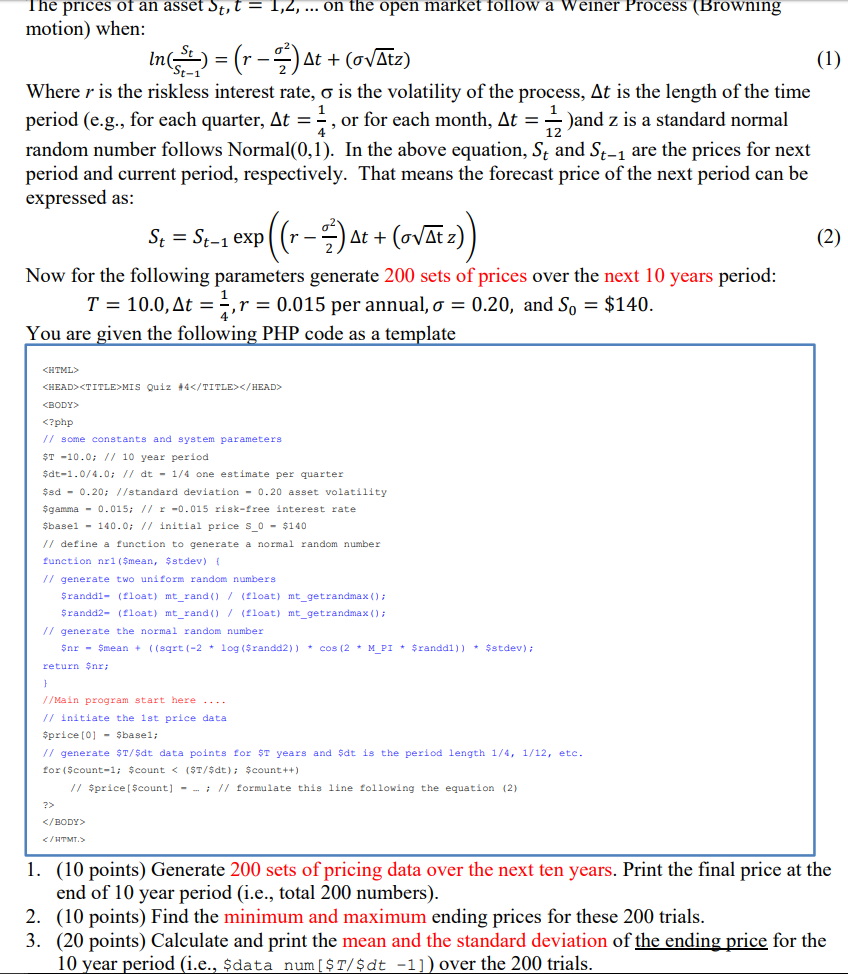
The prices of an asset St,1,2,. on the open market follow a Weiner Process (Browning motion) when: Where r is the riskless interest rate, is the volatility of the process. At is the length of the time period (e.g., for each quarter, At --, or for each month, At - )and z is a standard normal random number follows Normal(0,1). In the above equation, St and St-1 are the prices for next period and current period, respectively. That means the forecast price of the next period can be expressed as 12 2 Now for the following parameters generate 200 sets of prices over the next 10 years period T= 10.0, At=-,r= 0.015 per annual, = 0.20, and So-$140 4 You are given the following PHP code as a template CHTML
MIS Quiz 4 (10 points) Generate 200 sets of pricing data over the next ten years. Print the final price at the end of 10 year period (i.e., total 200 numbers) (10 points) Find the minimum and maximum ending prices for these 200 trials. (20 points) Calculate and print the mean and the standard deviation of the ending price for the 10 year period (i.e., $data num[$T/$dt -11 over the 200 trials 1. 2. 3. The prices of an asset St,1,2,. on the open market follow a Weiner Process (Browning motion) when: Where r is the riskless interest rate, is the volatility of the process. At is the length of the time period (e.g., for each quarter, At --, or for each month, At - )and z is a standard normal random number follows Normal(0,1). In the above equation, St and St-1 are the prices for next period and current period, respectively. That means the forecast price of the next period can be expressed as 12 2 Now for the following parameters generate 200 sets of prices over the next 10 years period T= 10.0, At=-,r= 0.015 per annual, = 0.20, and So-$140 4 You are given the following PHP code as a template CHTML
MIS Quiz 4 (10 points) Generate 200 sets of pricing data over the next ten years. Print the final price at the end of 10 year period (i.e., total 200 numbers) (10 points) Find the minimum and maximum ending prices for these 200 trials. (20 points) Calculate and print the mean and the standard deviation of the ending price for the 10 year period (i.e., $data num[$T/$dt -11 over the 200 trials 1. 2. 3


