

Answered step by step
Verified Expert Solution
Question
1 Approved Answer
The problem is to use the given information to calculate the remaining information G . First Year Assignment Assumptions Hist. Year 0 Proj. Year 1
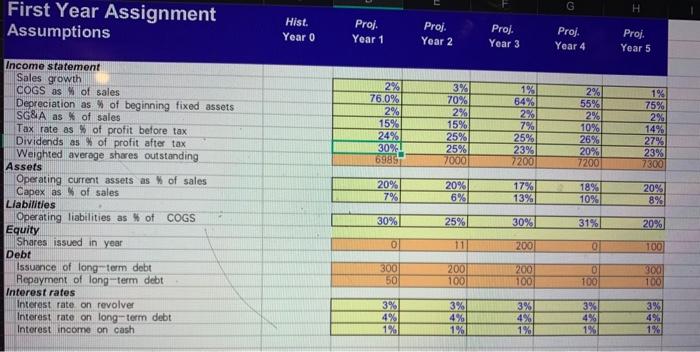
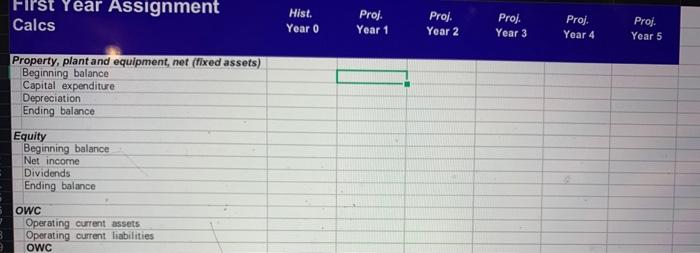
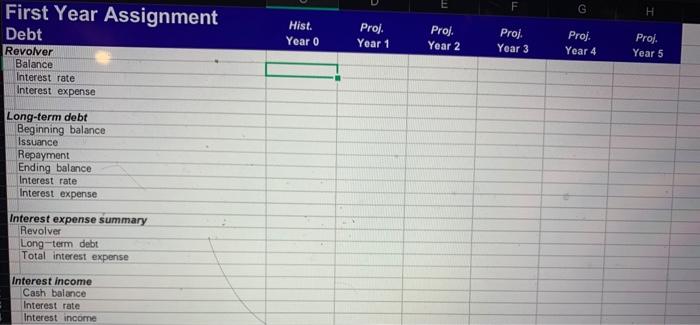
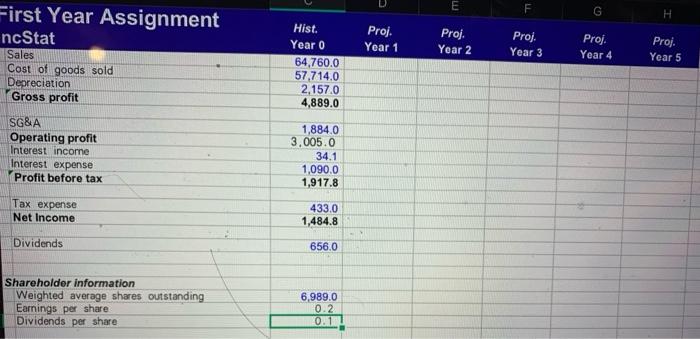
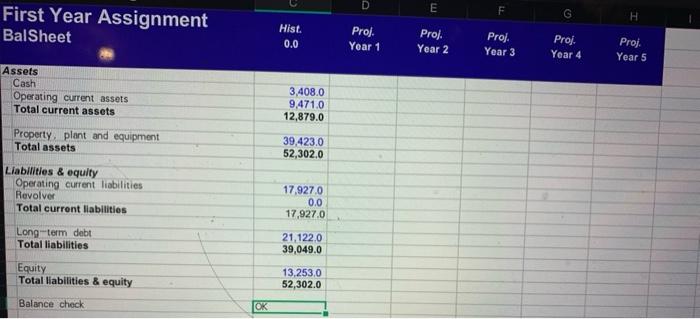
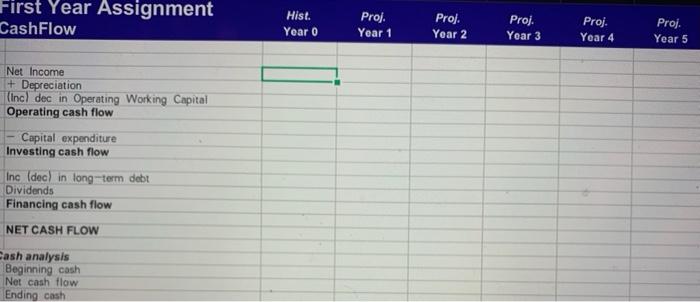
The problem is to use the given information to calculate the remaining information
G . First Year Assignment Assumptions Hist. Year 0 Proj. Year 1 Proj. Proj Year 3 Proj. Year 2 Year 4 Proj. Year 5 2% 55% 2% 76.0% 2% 15% 24% 30% 2% 3% 70% 2% 15% 25% 25% 7000 1% 64% 2% 7% 25% 23% 7200 10% 26% 20% 7200 1% 75% 2% 14% 27% 23% 69857 7300 Income statement Sales growth COGS as of sales Depreciation as % of beginning fixed assets SG&A as * of sales Tax rate as % of profit before tax Dividends as of profit after tax Weighted average shares outstanding Assets Operating current assets as of sales Capex as of sales Llabilities Operating liabilities as % of COGS Equity Shares issued in year Debt Issuance of long-term debt Repayment of long-term debt Interest rates Interest rate on revolver Interest rate on long-term debt Interest income on cash 20% 7% 20% 6% 17% 13% 18% 10% 20% 30% 25% 30% 31% 20% 0 11 200 0 100 300 200 100 200 100 0 100 100 3% 3% 3% 4% 1% 3% 4% 1% 1% 1% First Year Assignment Calcs Hist. Year 0 Prof. Year 1 Proj. Year 2 Proj. Year 3 Proj. Year 4 Proj. Year 5 Property, plant and equipment, net (fixed assets) Beginning balance Capital expenditure Depreciation Ending balance Equity Beginning balance Net income Dividends Ending balance OWC Operating current assets Operating current liabilities OWC E F G . First Year Assignment Debt Hist. Year 0 Proj. Proj. Year 2 Year 1 Proj Year 3 Proj. Year 4 Prof. Year 5 Revolver Balance Interest rate Interest expense Long-term debt Beginning balance Issuance Repayment Ending balance Interest rate Interest expense Interest expense summary Revolver Long-term debt Total interest expense Interest income Cash balance Interest rate Interest income E F G H First Year Assignment ncStat Proj. Year 1 Proj. Year 2 Proj. Year 3 Proj. Year 4 Proj. Year 5 Sales Cost of goods sold Depreciation Gross profit Hist. Year 0 64,760.0 57,714.0 2,157.0 4,889.0 SG&A Operating profit Interest income Interest expense Profit before tax 1,884.0 3,005.0 34.1 1,090.0 1,917.8 Tax expense Net Income 433.0 1,484.8 Dividends 656.0 Shareholder information Weighted average shares outstanding Earnings per share Dividends per share 6,989.0 0.2 0.1 D E F G H First Year Assignment BalSheet Hist. 0.0 Proj. Year 1 Proj. Year 2 Proj. Year 3 Proj. Year 4 Proj. Year 5 Assets Cash Operating current assets Total current assets 3,408.0 9,471.0 12,879.0 Property, plant and equipment Total assets 39,423.0 52,302.0 Liabilities & equity Operating current liabilities Revolver Total current liabilities 17,9270 0.0 17,927.0 Long-term debt Total liabilities 21.122.0 39,049.0 Equity Total liabilities & equity 13,253,0 52,302.0 Balance check | OK First Year Assignment CashFlow Hist. Year 0 Proj. Year 1 Proj Year 2 Proj. Year 3 Proj Proj. Year 5 Year 4 Net Income + Depreciation (Inc) dec in Operating Working Capital Operating cash flow Capital expenditure Investing cash flow Inc (dec) in long-term debt Dividends Financing cash flow NET CASH FLOW Cash analysis Beginning cash Net cash flow Ending cash G . First Year Assignment Assumptions Hist. Year 0 Proj. Year 1 Proj. Proj Year 3 Proj. Year 2 Year 4 Proj. Year 5 2% 55% 2% 76.0% 2% 15% 24% 30% 2% 3% 70% 2% 15% 25% 25% 7000 1% 64% 2% 7% 25% 23% 7200 10% 26% 20% 7200 1% 75% 2% 14% 27% 23% 69857 7300 Income statement Sales growth COGS as of sales Depreciation as % of beginning fixed assets SG&A as * of sales Tax rate as % of profit before tax Dividends as of profit after tax Weighted average shares outstanding Assets Operating current assets as of sales Capex as of sales Llabilities Operating liabilities as % of COGS Equity Shares issued in year Debt Issuance of long-term debt Repayment of long-term debt Interest rates Interest rate on revolver Interest rate on long-term debt Interest income on cash 20% 7% 20% 6% 17% 13% 18% 10% 20% 30% 25% 30% 31% 20% 0 11 200 0 100 300 200 100 200 100 0 100 100 3% 3% 3% 4% 1% 3% 4% 1% 1% 1% First Year Assignment Calcs Hist. Year 0 Prof. Year 1 Proj. Year 2 Proj. Year 3 Proj. Year 4 Proj. Year 5 Property, plant and equipment, net (fixed assets) Beginning balance Capital expenditure Depreciation Ending balance Equity Beginning balance Net income Dividends Ending balance OWC Operating current assets Operating current liabilities OWC E F G . First Year Assignment Debt Hist. Year 0 Proj. Proj. Year 2 Year 1 Proj Year 3 Proj. Year 4 Prof. Year 5 Revolver Balance Interest rate Interest expense Long-term debt Beginning balance Issuance Repayment Ending balance Interest rate Interest expense Interest expense summary Revolver Long-term debt Total interest expense Interest income Cash balance Interest rate Interest income E F G H First Year Assignment ncStat Proj. Year 1 Proj. Year 2 Proj. Year 3 Proj. Year 4 Proj. Year 5 Sales Cost of goods sold Depreciation Gross profit Hist. Year 0 64,760.0 57,714.0 2,157.0 4,889.0 SG&A Operating profit Interest income Interest expense Profit before tax 1,884.0 3,005.0 34.1 1,090.0 1,917.8 Tax expense Net Income 433.0 1,484.8 Dividends 656.0 Shareholder information Weighted average shares outstanding Earnings per share Dividends per share 6,989.0 0.2 0.1 D E F G H First Year Assignment BalSheet Hist. 0.0 Proj. Year 1 Proj. Year 2 Proj. Year 3 Proj. Year 4 Proj. Year 5 Assets Cash Operating current assets Total current assets 3,408.0 9,471.0 12,879.0 Property, plant and equipment Total assets 39,423.0 52,302.0 Liabilities & equity Operating current liabilities Revolver Total current liabilities 17,9270 0.0 17,927.0 Long-term debt Total liabilities 21.122.0 39,049.0 Equity Total liabilities & equity 13,253,0 52,302.0 Balance check | OK First Year Assignment CashFlow Hist. Year 0 Proj. Year 1 Proj Year 2 Proj. Year 3 Proj Proj. Year 5 Year 4 Net Income + Depreciation (Inc) dec in Operating Working Capital Operating cash flow Capital expenditure Investing cash flow Inc (dec) in long-term debt Dividends Financing cash flow NET CASH FLOW Cash analysis Beginning cash Net cash flow Ending cash Step by Step Solution
There are 3 Steps involved in it
Step: 1

Get Instant Access to Expert-Tailored Solutions
See step-by-step solutions with expert insights and AI powered tools for academic success
Step: 2

Step: 3
Ace Your Homework with AI
Get the answers you need in no time with our AI-driven, step-by-step assistance
Get Started
The Cyber Attack Survival Manual
Authors: Heather Vescent ,Nick Selby
1st Edition
1681886545, 978-1681886541