

Answered step by step
Verified Expert Solution
Question
1 Approved Answer
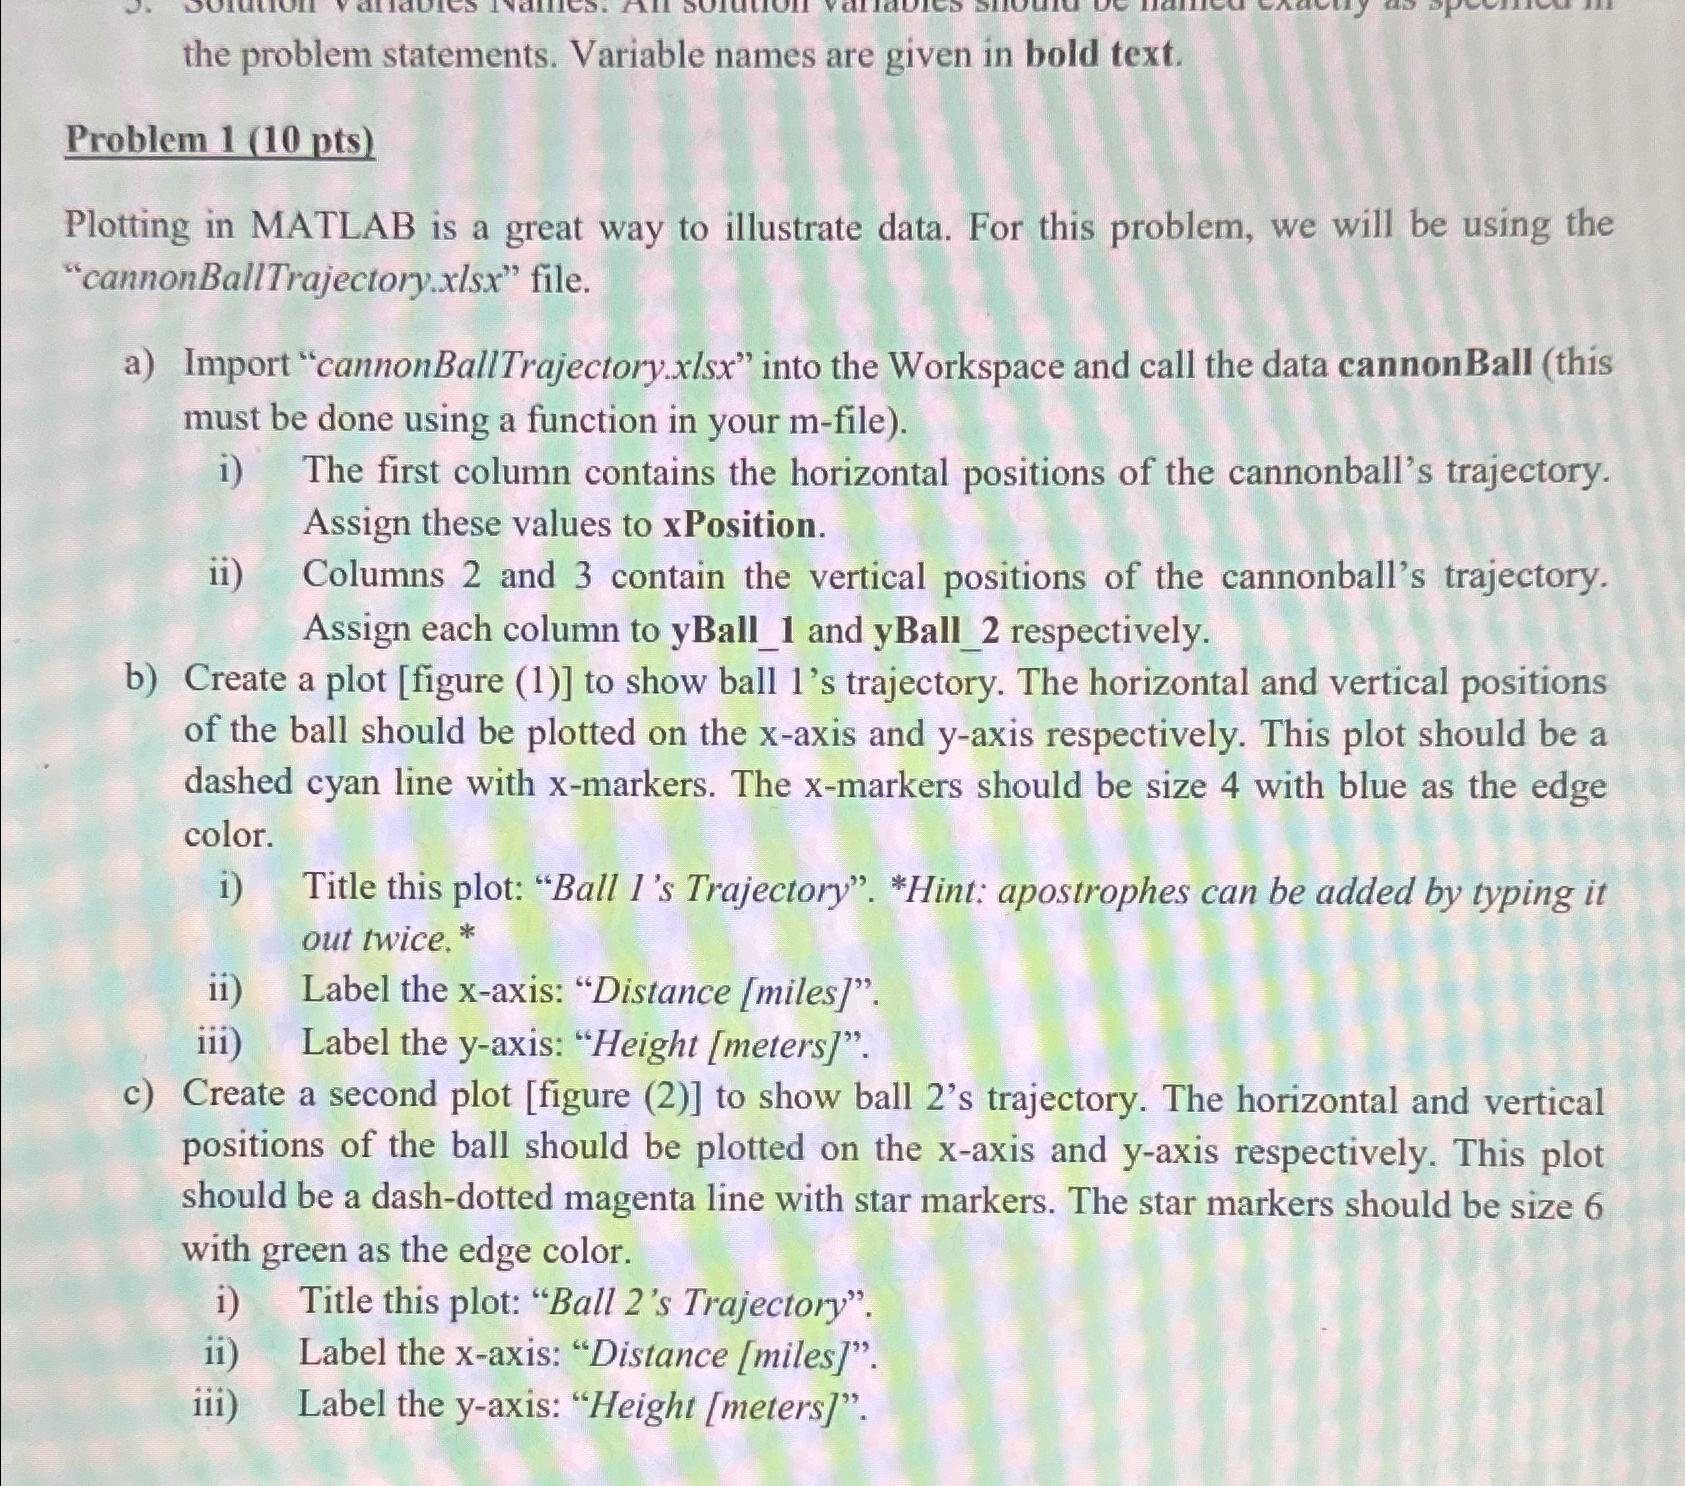
the problem statements. Variable names are given in bold text. Problem 1 ( 1 0 pts ) Plotting in MATLAB is a great way to
the problem statements. Variable names are given in bold text.
Problem pts
Plotting in MATLAB is a great way to illustrate data. For this problem, we will be using the "cannonBallTrajectory file.
a Import "cannonBallTrajectory.xlsx into the Workspace and call the data cannonBall this must be done using a function in your file
i The first column contains the horizontal positions of the cannonball's trajectory. Assign these values to xPosition.
ii Columns and contain the vertical positions of the cannonball's trajectory. Assign each column to yBall and yBall respectively.
b Create a plot figure to show ball s trajectory. The horizontal and vertical positions of the ball should be plotted on the axis and axis respectively. This plot should be a dashed cyan line with markers. The markers should be size with blue as the edge color.
i Title this plot: "Ball Is Trajectory". Hint: apostrophes can be added by typing it out twice.
ii Label the xaxis: "Distance miles
iii Label the yaxis: "Height meters
c Create a second plot figure to show ball s trajectory. The horizontal and vertical positions of the ball should be plotted on the axis and axis respectively. This plot should be a dashdotted magenta line with star markers. The star markers should be size with green as the edge color.
i Title this plot: "Ball s Trajectory".
ii Label the xaxis: "Distance miles
iii Label the yaxis: "Height meters
Step by Step Solution
There are 3 Steps involved in it
Step: 1

Get Instant Access to Expert-Tailored Solutions
See step-by-step solutions with expert insights and AI powered tools for academic success
Step: 2

Step: 3
Ace Your Homework with AI
Get the answers you need in no time with our AI-driven, step-by-step assistance
Get Started
Intelligent Databases Object Oriented Deductive Hypermedia Technologies
Authors: Kamran Parsaye, Mark Chignell, Setrag Khoshafian, Harry Wong
1st Edition
0471503452, 978-0471503453