Answered step by step
Verified Expert Solution
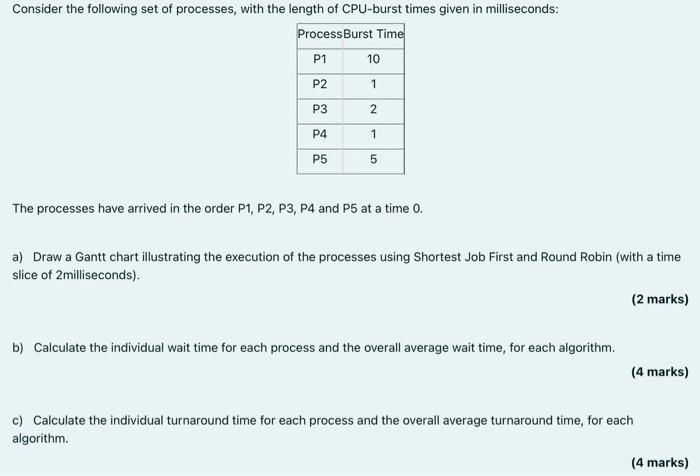
Link Copied!

Question

1 Approved Answer

The processes have arrived in the order P1,P2,P3,P4 and P5 at a time 0 . a) Draw a Gantt chart illustrating the execution of the

image text in transcribed
The processes have arrived in the order P1,P2,P3,P4 and P5 at a time 0 . a) Draw a Gantt chart illustrating the execution of the processes using Shortest Job First and Round Robin (with a time slice of 2 milliseconds). (2 marks) b) Calculate the individual wait time for each process and the overall average wait time, for each algorithm. (4 marks) c) Calculate the individual turnaround time for each process and the overall average turnaround time, for each algorithm. (4 marks)

Step by Step Solution

There are 3 Steps involved in it

Step: 1

blur-text-image

Get Instant Access to Expert-Tailored Solutions

See step-by-step solutions with expert insights and AI powered tools for academic success

Step: 2

blur-text-image

Step: 3

blur-text-image

Ace Your Homework with AI

Get the answers you need in no time with our AI-driven, step-by-step assistance

Get Started

Recommended Textbook for

Generative Artificial Intelligence For Project Management With Aws

Authors: Timothy Krimmel

1st Edition

B0CQV9KWB8, 979-8872627197

More Books

Students also viewed these Databases questions

Question

1. I try to create an image of the message

Answered: 1 week ago