Answered step by step
Verified Expert Solution
Link Copied!

Question

1 Approved Answer

The production department of Celltronics International wants to explore the relationship between the number of employees who assemble a subassembly and the number produced. As

The production department of Celltronics International wants to explore the relationship between the number of employees who assemble a subassembly and the number produced. As an experiment, two employees were assigned to assemble the parts. They produced 15 during a one-hour period. Then, four employees assembled them. They produced 25 during a one-hour period. The complete set of paired observations follows:

Number of

AssemblersOne-Hour

Production (units)215425110540330

The dependent variable is production; that is, it is assumed that the level of production depends on the number of employees.

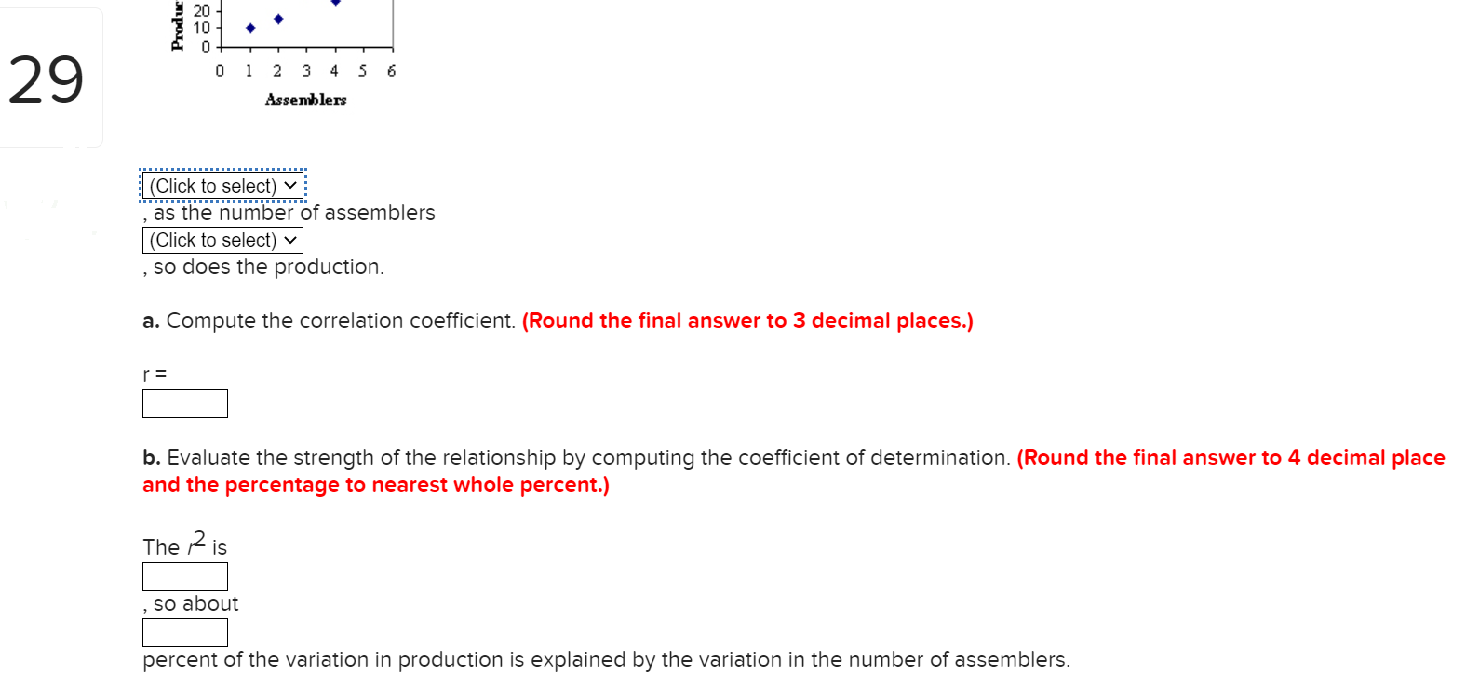
A scatter diagram is provided below. Based on it, does there appear to be any relationship between the number of assemblers and production?

(Click to select)

Yes

No

, as the number of assemblers

(Click to select)

increases

decreases

, so does the production.

a.Compute the correlation coefficient.(Round the final answer to 3 decimal places.)

r =

b.Evaluate the strength of the relationship by computing the coefficient of determination.(Round the final answer to 4 decimal place and the percentage to nearest whole percent.)

Ther2is

, so about

percent of the variation in production is explainedby the variation in the number of assemblers.
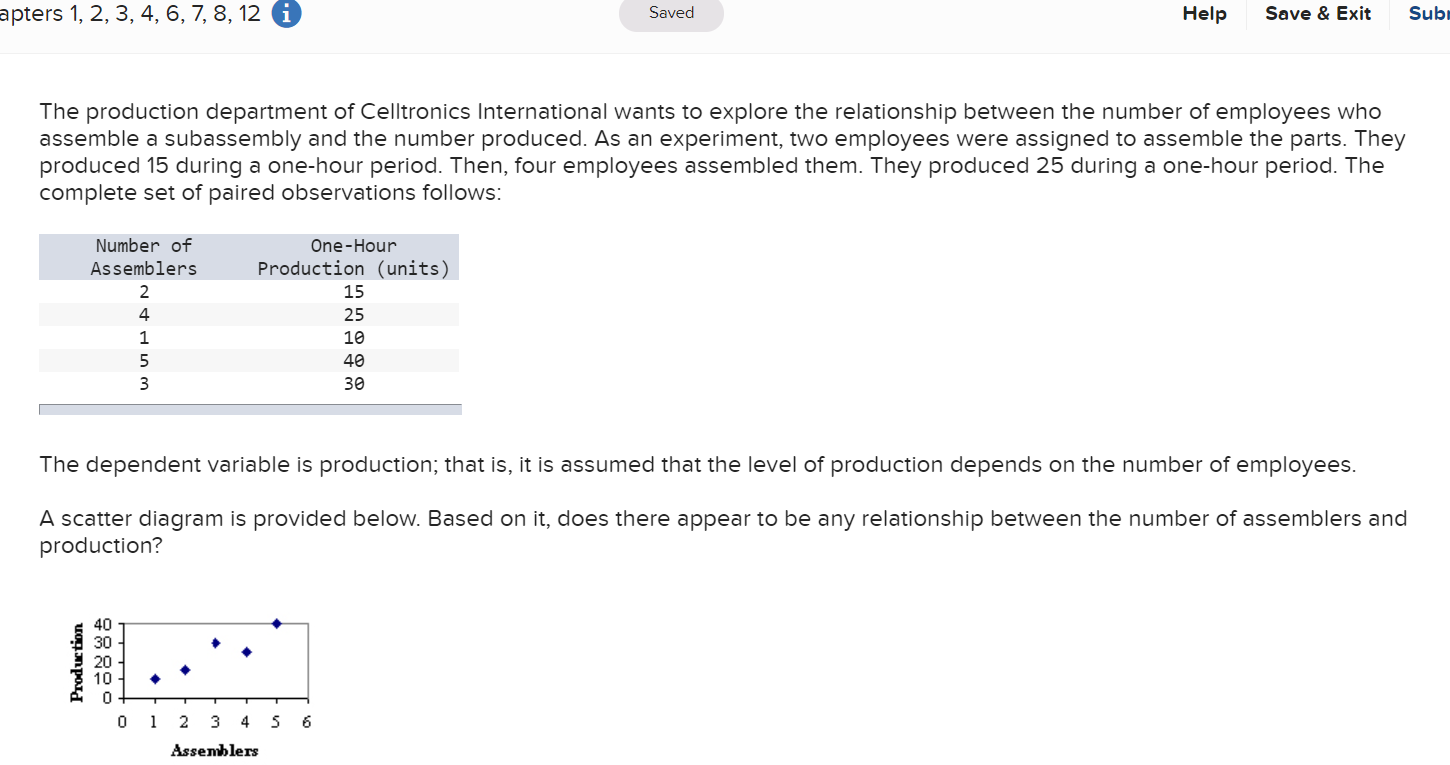
image text in transcribedimage text in transcribed
apters 1, 2, 3, 4, 6, 7, 8, 12 0 Saved Help Saves. Exit Subl The production department of Celltronics International wants to explore the relationship between the number ofemployees who assemble a subassembly and the number produced. As an experiment, two employees were assigned to assemble the parts. They produced 15 during a one-hour period. Then, four employees assembled them. They produced 25 during a one-hour period. The complete set of paired observations follows: Number of One-Hour Assembler's Production (units) 15 25 18 48 38 wlni-I-PN The dependent variable is production; that is, it is assumed that the level of production depends on the number ofemployees. A scatter diagram is provided below. Based on it, does there appear to be any relationship between the number of assemblers and production? 20 Produc 29 0 1 2 3 4 5 6 Assemblers (Click to select) v as the number of assemblers (Click to select) v , so does the production. a. Compute the correlation coefficient. (Round the final answer to 3 decimal places.) r= b. Evaluate the strength of the relationship by computing the coefficient of determination. (Round the final answer to 4 decimal place and the percentage to nearest whole percent.) The Ris so about percent of the variation in production is explained by the variation in the number of assemblers

Step by Step Solution

There are 3 Steps involved in it

Step: 1

blur-text-image

Get Instant Access to Expert-Tailored Solutions

See step-by-step solutions with expert insights and AI powered tools for academic success

Step: 2

blur-text-image

Step: 3

blur-text-image

Ace Your Homework with AI

Get the answers you need in no time with our AI-driven, step-by-step assistance

Get Started

Recommended Textbook for

Mcdougal Littell High School Math Algebra 1 2012

Authors: Ron Larson, Laurie Boswell, Timothy D. Kanold, Lee Stiff

1st Edition

9780547476841, 0547476841

More Books

Students also viewed these Mathematics questions