

Question
The production of wine is a multibillion-dollar worldwide industry. In an attempt to develop a model of wine quality as judged by wine experts, data
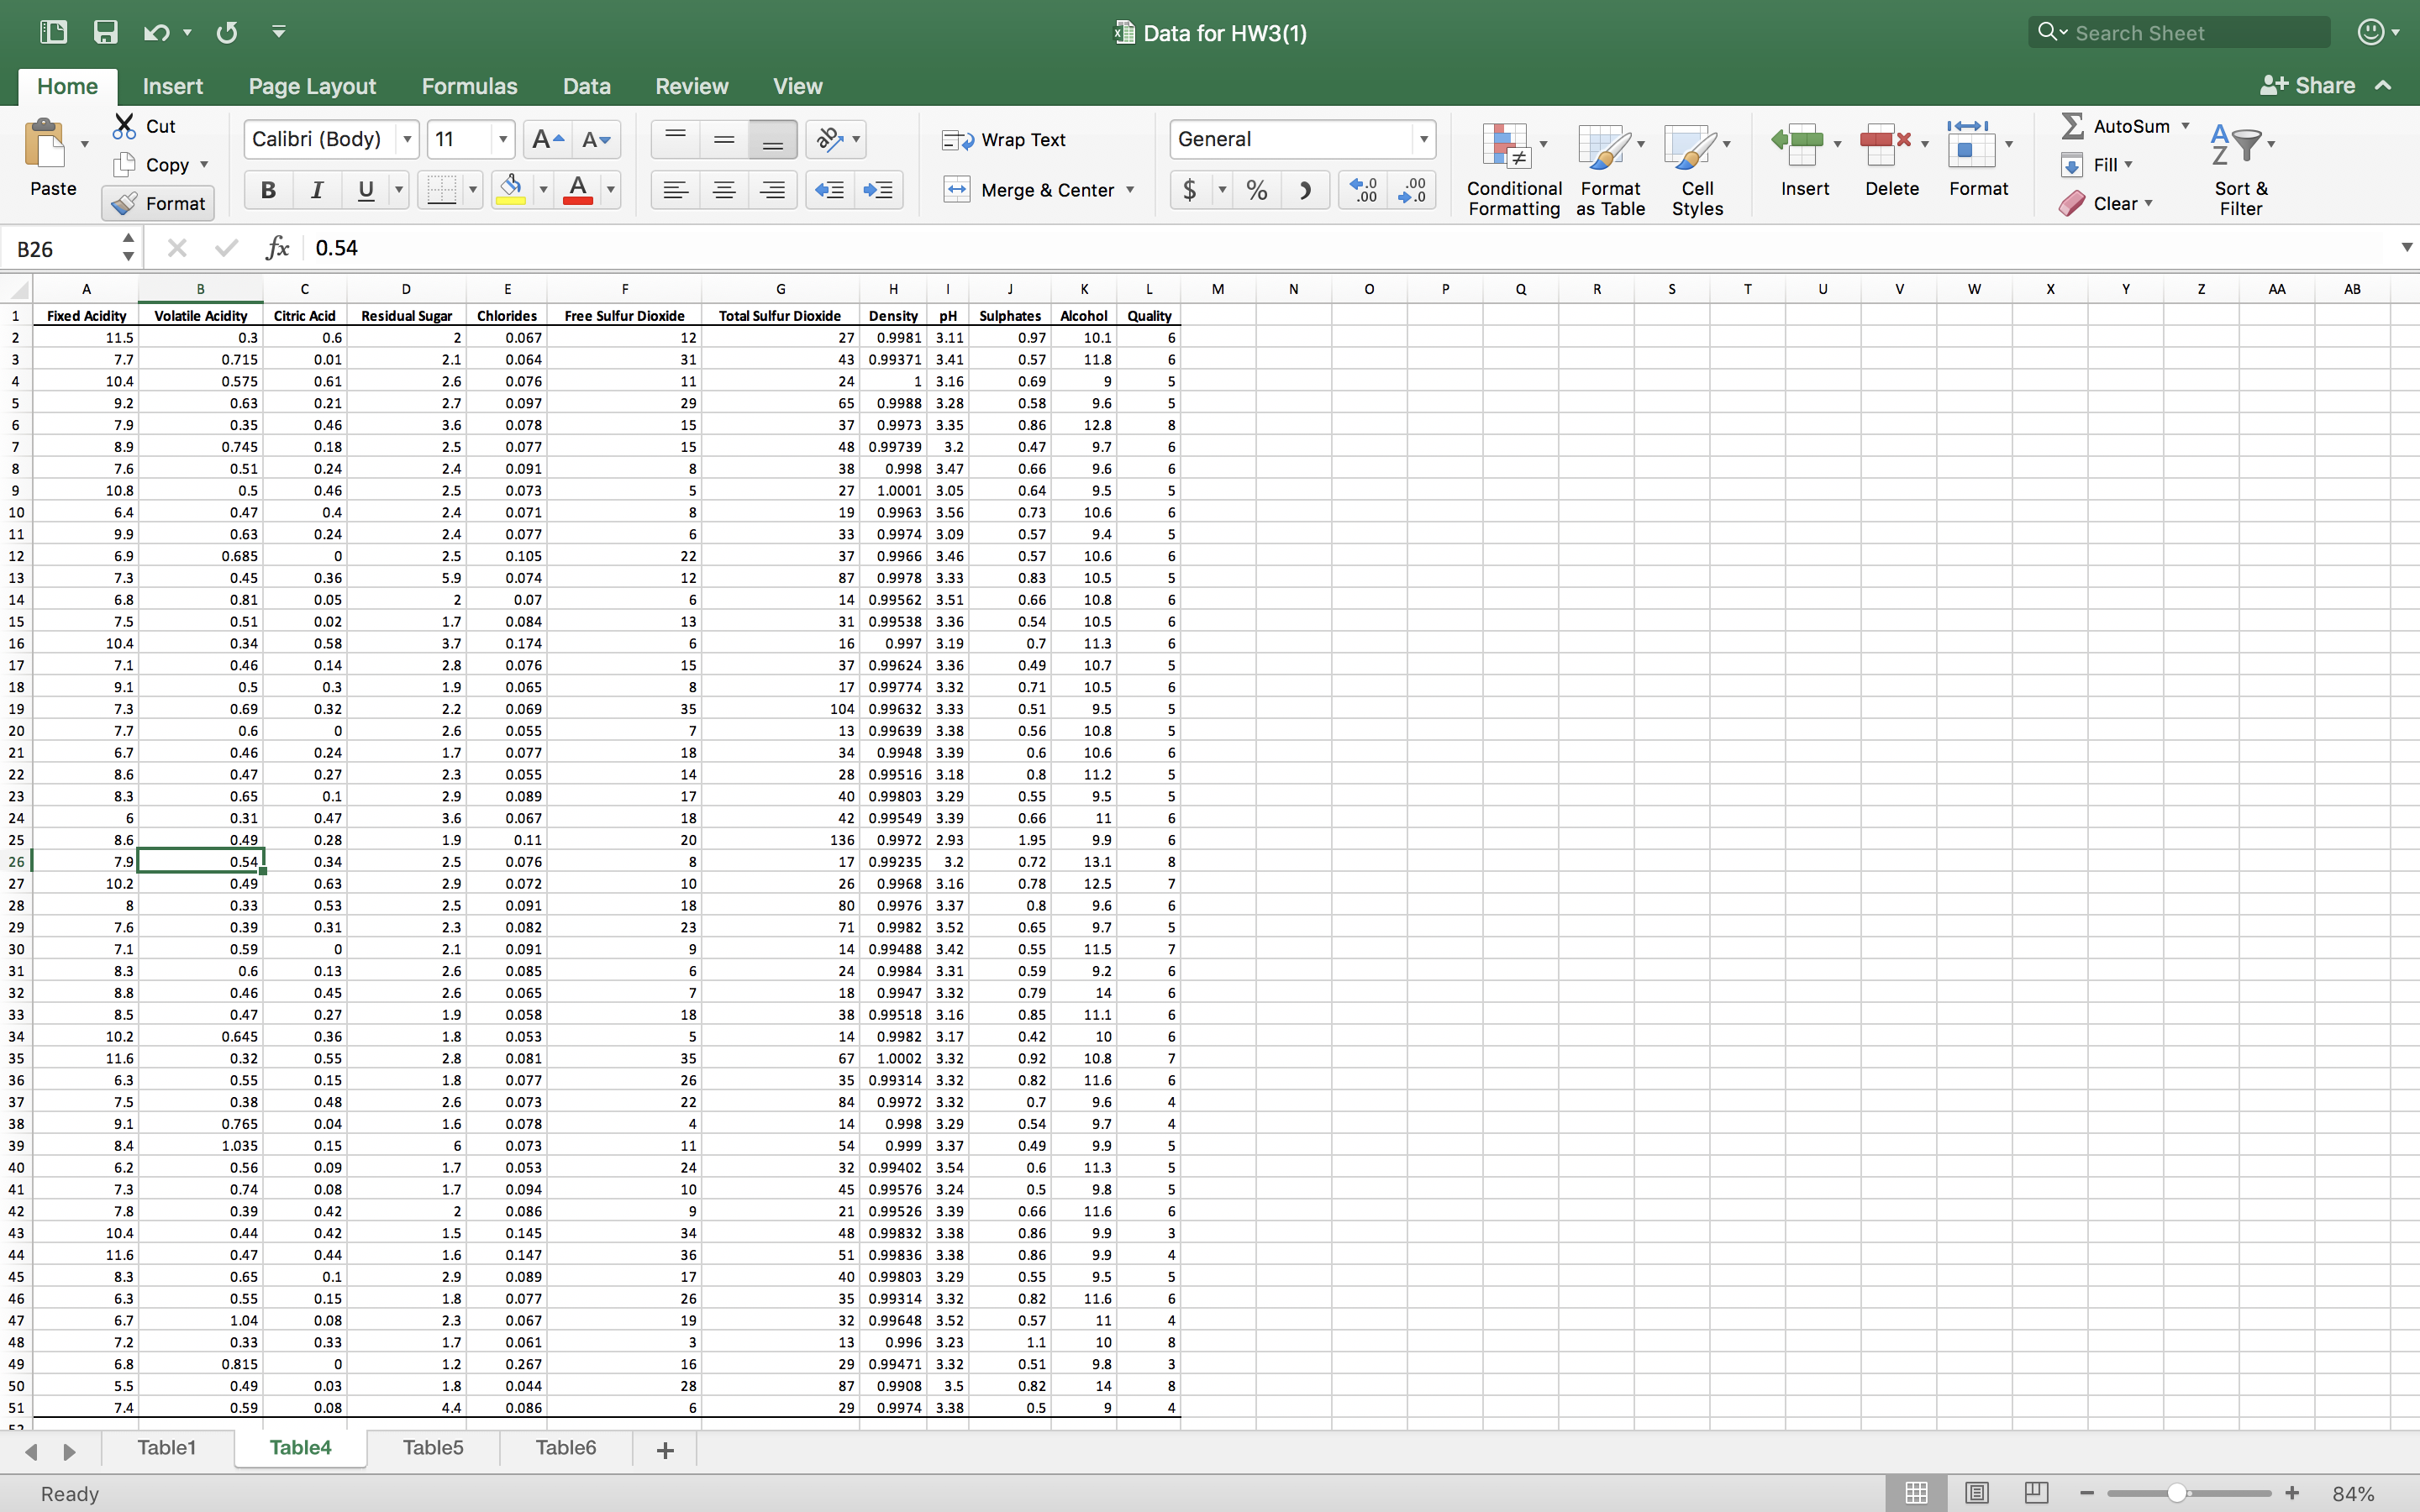
The production of wine is a multibillion-dollar worldwide industry. In an attempt to develop a model of wine quality as judged by wine experts, data was collected from red wine variants of Portuguese "Vinho Verde" wine. A sample of 50 wines is stored in the table. Develop a multiple linear regression model to predict wine quality, measured on a scale from 0 (very bad) to 10 (excellent) based on alcohol content (%) and the amount of chlorides.
1- Interpret the meaning of the slope for Alcohol. Multiple CHoice)
a. For every 1 unit of Quality, Alcohol increases by 0.496, holding Chlorides constant.
b. For every 1 unit of Alcohol, Quality increases by 0.496, holding Chlorides constant.
c. For every 0.496 unit of Quality, Alcohol increases by 1, holding Chlorides constant.
d. For every 0.496 unit of Alcohol, Quality increases by 1, holding Chlorides constant.
2- Referring to the table, predict the mean wine quality rating for wines that have 10% alcohol and chlorides of 0.08
3- Referring to the table, construct a 95% confidence interval estimate for the mean wine quality rating for wines that have 10% alcohol and chlorides of 0.08. What is the lower limit of that confidence interval?
4- Referring to the table, construct a 99% prediction interval for the wine quality rating for an individual wine that has 10% alcohol and chlorides of 0.08. What is the upper limit of that prediction interval?
5- Referring to the table, which phrase would be part of the interpretation of the 99% prediction interval? (Multiple Choice)
a. If a group of wines that all had 10% alcohol and chlorides of 0.08 were selected, we would be 99% confident that their average wine quality rating would be between _____ and _____.
b. If a group of wines that all had 10% alcohol and chlorides of 0.08 were selected, we would be 99% confident that their wine quality rating would be between _____ and _____.
c. If an individual wine with 10% alcohol and chlorides of 0.08 was selected, we would be 99% confident that the wine quality rating would be between _____ and _____.
d. If an individual wine with 10% alcohol and chlorides of 0.08 was selected, we would be 99% confident that their average wine quality rating would be between _____ and _____.
6- Referring to the table, what is the test statistic to conduct the test of Ho: ?1 = ?2 = 0?
7- Referring to the table, what is the conclusion of the test of Ho: ?1 = ?2 = 0 at a 0.05 level of significance? (Multiple Choice)
a. We do have evidence that both variables of Alcohol and Chlorides are significant predictors of Quality.
b. We do not have evidence that both variables of Alcohol and Chlorides are significant predictors of Quality.
c. We do not have evidence that at least 1 of the variables of Alcohol and Chlorides are significant predictors of Quality.
d. We do have evidence that at least 1 of the variables of Alcohol and Chlorides are significant predictors of Quality.
8- Referring to the table, what is the p-value to conduct the test of Ho: ?chlorides = 0?
9- Referring to the table, what is the conclusion of the test of Ho: ?chlorides = 0 if alpha = 0.01? (Multiple Choice)
a. We do not have evidence that Chlorides is a significant predictor of Quality.
b. We do have evidence that Chlorides is a significant predictor of Quality.
c. We do not have evidence that Quality is a significant predictor of Chlorides.
d. We do have evidence that Quality is a significant predictor of Chlorides.
10- Referring to the table, look at the Residuals vs. Chlorides plot. From this plot you conclude: (Multiple Choice)
a. The equal variance assumption is met.
b. The equal variance assumption is violated.
c. The normality assumption is met.
d. The normality assumption is violated.
11-Referring to the table, look at the Residuals vs. Alcohol plot. From this plot you conclude: (Multiple Choice)
a. The independence assumption is met.
b. The independence assumption is violated.
c. The linearity assumption is met.
d. The linearity assumption is violated.
12- Referring to the table: please help with creating dummy variable where pH above 3.5 is high and 3.5 or below is low.Let high=1.Add this dummy variable to a model with the percentage of alcohol, chlorides to predict the quality of red wines.What is the p-value of the dummy variable?
13- Referring to the table, what is the decision in regards to the significance of the dummy variable in the previous questionat 0.05 significance level?(Multiple Choice)
a. Wedo Reject Ho.We do have evidence that the dummy variable is a significant predictor of wine quality.
b. Wedo Reject Ho.We do not have evidence that the dummy variable is a significant predictor of wine quality.
c. We do not Reject Ho.We do have evidence that the dummy variable is a significant predictor of wine quality.
d. We do not Reject Ho.We do not have evidence that the dummy variable is a significant predictor of wine quality.
14- Referring to the table, how do you interpret the dummy variable for pH? (Multiple Choice)
a. If the pH is high,the quality decreases by 0.68.
b. If the pH is high,the quality decreases by 0.68,holding Alcohol and Chlorides constant.
c. For every 1 unit of pH added,the quality decreases by0.68.
d. For every 1 unit ofpH added,the quality decreases by0.68,holding Alcohol and Chlorides constant.
15- Referring to the table, help me create interaction term between the percentage of alcohol and chlorides and build a new model, not including the dummy variable.What is the p-value of the interaction term?
16- Referring to the previous question, at a significance level of 0.10, what is the decision in regards to the interaction term? (Multiple Choice)
a. It is a significant predictor of wine quality.
b. It is not a significant predictor of wine quality.
c. Weare unable to determine if it is a significant predictor of wine quality.
DATA IS ATTACHED IN SCREENSHOT
Step by Step Solution
There are 3 Steps involved in it
Step: 1

Get Instant Access to Expert-Tailored Solutions
See step-by-step solutions with expert insights and AI powered tools for academic success
Step: 2

Step: 3
Ace Your Homework with AI
Get the answers you need in no time with our AI-driven, step-by-step assistance
Get Started
Financial Algebra advanced algebra with financial applications
Authors: Robert K. Gerver
1st edition
ISBN: 978-1285444857, 128544485X, 978-0357229101, 035722910X, 978-0538449670