

Answered step by step
Verified Expert Solution
Question
1 Approved Answer
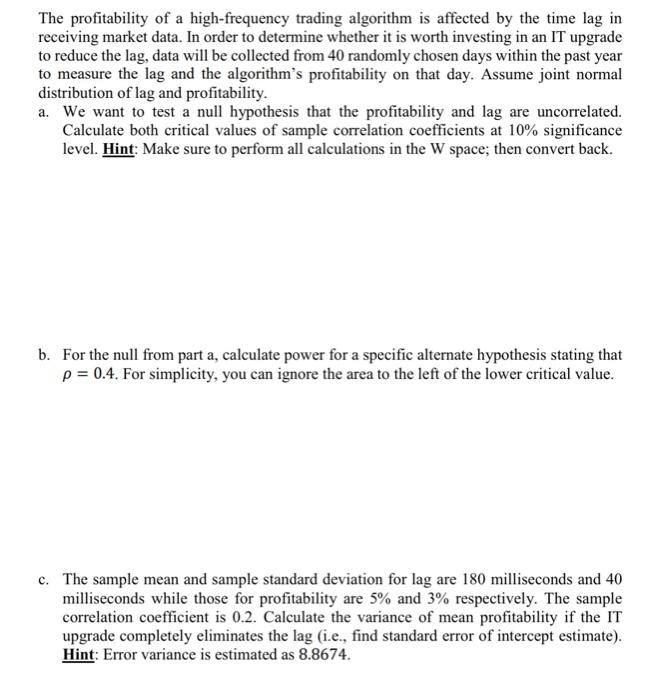
The profitability of a high-frequency trading algorithm is affected by the time lag in receiving market data. In order to determine whether it is worth
Step by Step Solution
There are 3 Steps involved in it
Step: 1

Get Instant Access to Expert-Tailored Solutions
See step-by-step solutions with expert insights and AI powered tools for academic success
Step: 2

Step: 3
Ace Your Homework with AI
Get the answers you need in no time with our AI-driven, step-by-step assistance
Get Started
The Engineers Cost Handbook Tools For Managing Project Costs
Authors: Richard E. Westney
1st Edition
0824797965, 978-0824797966