Answered step by step
Verified Expert Solution
Link Copied!

Question

1 Approved Answer

The profitarea on a CVP graph which displays the Total Cost line and the Sales line, is: Multiple Choice Below the bakeven point The area
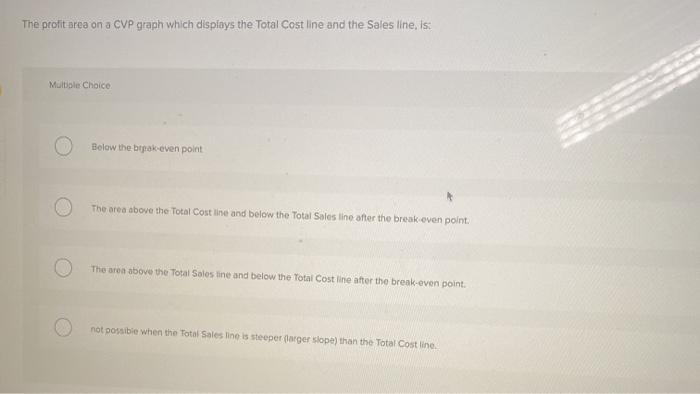
image text in transcribed
The profitarea on a CVP graph which displays the Total Cost line and the Sales line, is: Multiple Choice Below the bakeven point The area above the Total Cost line and below the Total Sales line after the break oven point. The area above the Total Solesine and below the Total Cost line after the break-even point, not possible when the Total Sales line is steeper (larger slope) than the Total Costine

Step by Step Solution

There are 3 Steps involved in it

Step: 1

blur-text-image

Get Instant Access to Expert-Tailored Solutions

See step-by-step solutions with expert insights and AI powered tools for academic success

Step: 2

blur-text-image_2

Step: 3

blur-text-image_3

Ace Your Homework with AI

Get the answers you need in no time with our AI-driven, step-by-step assistance

Get Started

Recommended Textbook for

Place Of Internal Audit And Management Control In Performance The Case Of The Bank

Authors: Hind Ben Khayat

1st Edition

6205968371, 978-6205968376

More Books

Students also viewed these Accounting questions

Question

Identify cultural barriers to communication.

Answered: 1 week ago