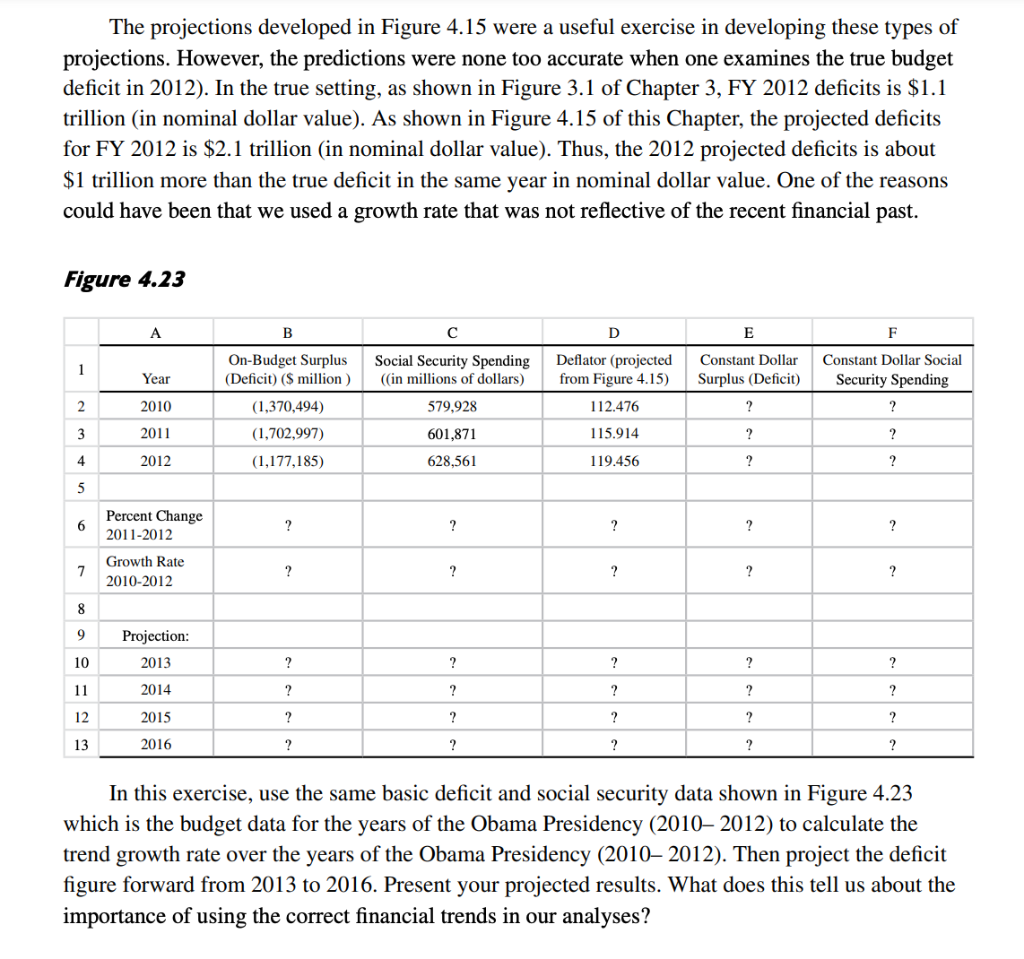
The projections developed in Figure 4.15 were a useful exercise in developing these types of projections. However, the predictions were none too accurate when one examines the true budget deficit in 2012). In the true setting, as shown in Figure 3.1 of Chapter 3, FY 2012 deficits is $1.1 trillion (in nominal dollar value). As shown in Figure 4.15 of this Chapter, the projected deficits for FY 2012 is $2.1 trillion (in nominal dollar value). Thus, the 2012 projected deficits is about $1 trillion more than the true deficit in the same year in nominal dollar value. One of the reasons could have been that we used a growth rate that was not reflective of the recent financial past. Figure 4.23 A B D E F 1 On-Budget Surplus (Deficit) ($ million) Social Security Spending (in millions of dollars) Constant Dollar Surplus (Deficit) Constant Dollar Social Security Spending Year Deflator (projected from Figure 4.15) 112.476 115.914 2 2010 579,928 ? ? (1,370,494) (1,702,997) 3 2011 601,871 ? ? 4 2012 (1,177,185) 628,561 119.456 ? ? 5 6 Percent Change 2011-2012 ? ? ? ? ? 7 Growth Rate 2010-2012 ? ? ? ? ? 8 9 Projection: 2013 10 ? ? ? ? ? 11 2014 ? ? ? ? ? 12 2015 ? ? ? ? ? 13 2016 ? ? ? ? ? In this exercise, use the same basic deficit and social security data shown in Figure 4.23 which is the budget data for the years of the Obama Presidency (2010 2012) to calculate the trend growth rate over the years of the Obama Presidency (20102012). Then project the deficit figure forward from 2013 to 2016. Present your projected results. What does this tell us about the importance of using the correct financial trends in our analyses? The projections developed in Figure 4.15 were a useful exercise in developing these types of projections. However, the predictions were none too accurate when one examines the true budget deficit in 2012). In the true setting, as shown in Figure 3.1 of Chapter 3, FY 2012 deficits is $1.1 trillion (in nominal dollar value). As shown in Figure 4.15 of this Chapter, the projected deficits for FY 2012 is $2.1 trillion (in nominal dollar value). Thus, the 2012 projected deficits is about $1 trillion more than the true deficit in the same year in nominal dollar value. One of the reasons could have been that we used a growth rate that was not reflective of the recent financial past. Figure 4.23 A B D E F 1 On-Budget Surplus (Deficit) ($ million) Social Security Spending (in millions of dollars) Constant Dollar Surplus (Deficit) Constant Dollar Social Security Spending Year Deflator (projected from Figure 4.15) 112.476 115.914 2 2010 579,928 ? ? (1,370,494) (1,702,997) 3 2011 601,871 ? ? 4 2012 (1,177,185) 628,561 119.456 ? ? 5 6 Percent Change 2011-2012 ? ? ? ? ? 7 Growth Rate 2010-2012 ? ? ? ? ? 8 9 Projection: 2013 10 ? ? ? ? ? 11 2014 ? ? ? ? ? 12 2015 ? ? ? ? ? 13 2016 ? ? ? ? ? In this exercise, use the same basic deficit and social security data shown in Figure 4.23 which is the budget data for the years of the Obama Presidency (2010 2012) to calculate the trend growth rate over the years of the Obama Presidency (20102012). Then project the deficit figure forward from 2013 to 2016. Present your projected results. What does this tell us about the importance of using the correct financial trends in our analyses


