

Question
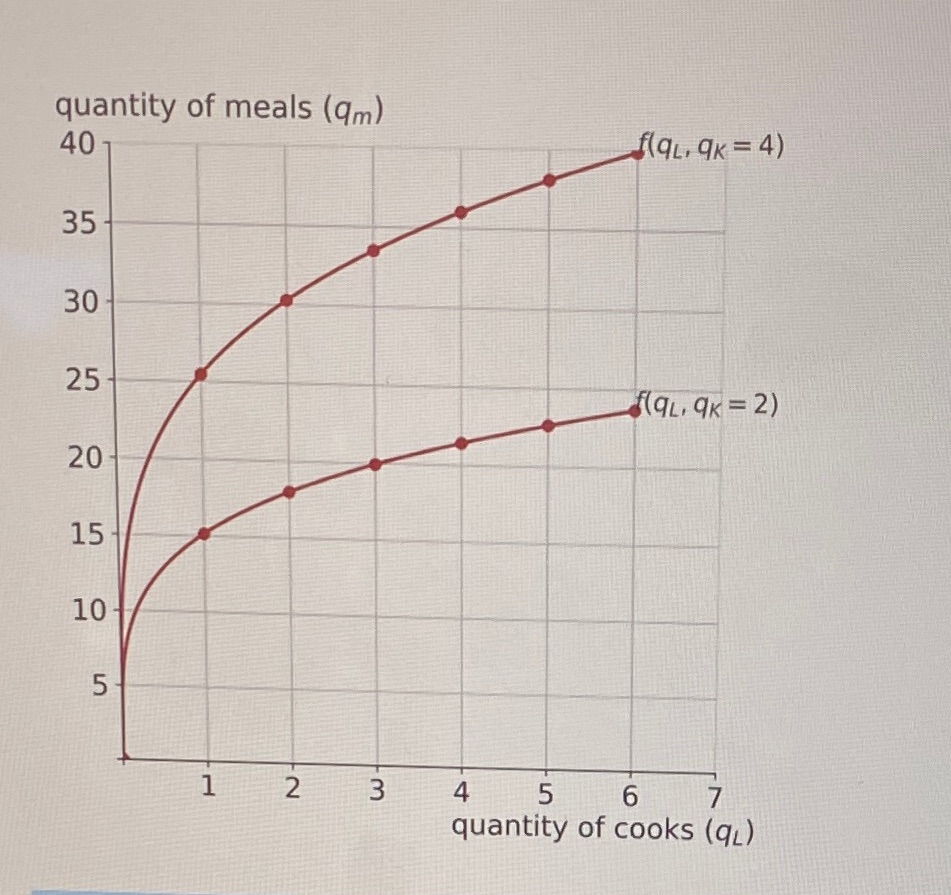
The provided figure illustrates the production function at a restaurant, where the number of meals produced (qm) is dependent on the numbers of cooks (ql)
The provided figure illustrates the production function at a restaurant, where the number of meals produced (qm) is dependent on the numbers of cooks (ql) and the number of stoves (qk) the production exhibits A. Decreasing returns to scaleB. Constant returns to scale C. Increasing returns to scale D. Variable returns to scale
Step by Step Solution
There are 3 Steps involved in it
Step: 1

Get Instant Access to Expert-Tailored Solutions
See step-by-step solutions with expert insights and AI powered tools for academic success
Step: 2

Step: 3
Ace Your Homework with AI
Get the answers you need in no time with our AI-driven, step-by-step assistance
Get Started
Principles Of Microeconomics 2e By OpenStax
Authors: OpenStax
2nd Edition
1947172344, 978-1947172340