Question
The purpose of this project is to give you practice using Excel to produce run charts and then interpreting them! It contains the quarterly number
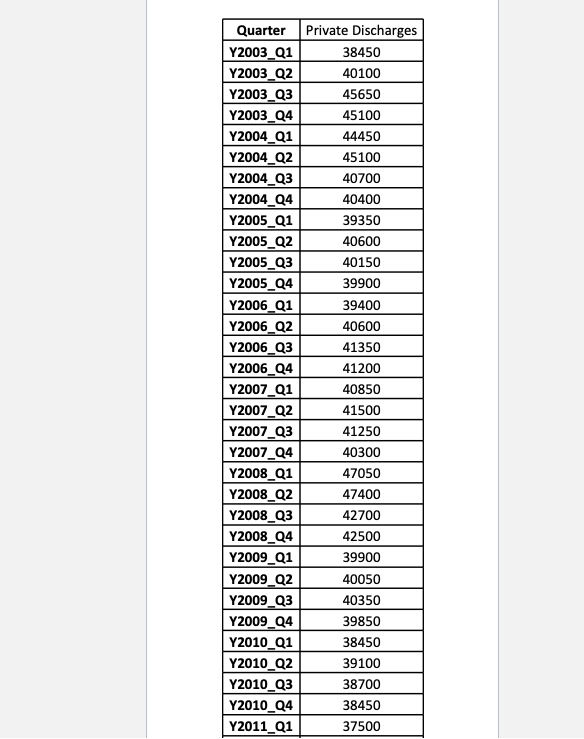
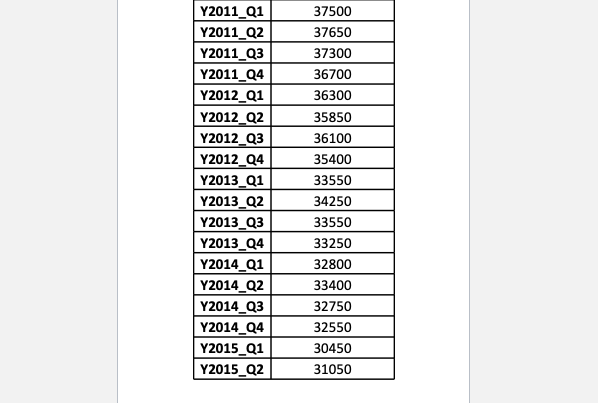
The purpose of this project is to give you practice using Excel to produce run charts and then interpreting them! It contains the quarterly number of discharges for private payers for the state of Arizona (a Medicaid Expansion State).
Prepare a run chart displaying the quarterly data!
Requirements:
1. Be sure to title the chart and label the x- and y-axes appropriately. Someone unfamiliar with your data should be able to understand your chart without you explaining it to them.
2. Remember that a run chart requires a median line. Excel won't automatically put the median line on your chart. You'll need to determine what the median of your data is and then add a column to your data that includes the median at each data point. That way Excel will display your d/c data and your median. Let me know if this is confusing.
Data:

Answer the following questions:
How many shifts did you find in the data?
How many trends did you find in the data?
How many runs did you find in the data?
Were there too many runs? (please answer with "Y" or "N")
Were there too few runs? (please answer with "Y" or "N")
How many astronomical points were there?
Quarter Private Discharges Y2003_01 38450 Y2003_02 40100 Y2003 Q3 45650 Y2003_04 45100 Y2004_Q1 44450 Y2004_Q2 45100 Y2004_Q3 40700 Y2004_04 40400 Y2005_01 39350 Y2005_Q2 40600 Y2005_03 40150 Y2005_04 39900 Y2006_Q1 39400 Y2006_Q2 40600 Y2006_Q3 41350 Y2006_Q4 41200 Y2007_01 40850 Y2007_02 41500 Y2007_Q3 41250 Y2007_04 40300 Y2008_Q1 47050 Y2008_Q2 47400 Y2008_Q3 42700 Y2008_94 42500 Y2009_01 39900 Y2009_Q2 40050 Y2009_03 40350 Y2009_04 39850 Y2010_01 38450 Y2010_02 39100 Y2010_Q3 38700 Y2010_04 38450 Y2011_01 37500 37500 37650 37300 36700 36300 Y2011_01 Y2011_02 Y2011_Q3 Y2011_04 Y2012_01 Y2012_Q2 Y2012_Q3 Y2012_04 Y2013_01 Y2013_02 Y2013_03 Y2013_04 Y2014_01 Y2014_Q2 Y2014_Q3 Y2014_24 Y2015_Q1 Y2015_Q2 35850 36100 35400 33550 34250 33550 33250 32800 33400 32750 32550 30450 31050 Quarter Private Discharges Y2003_01 38450 Y2003_02 40100 Y2003 Q3 45650 Y2003_04 45100 Y2004_Q1 44450 Y2004_Q2 45100 Y2004_Q3 40700 Y2004_04 40400 Y2005_01 39350 Y2005_Q2 40600 Y2005_03 40150 Y2005_04 39900 Y2006_Q1 39400 Y2006_Q2 40600 Y2006_Q3 41350 Y2006_Q4 41200 Y2007_01 40850 Y2007_02 41500 Y2007_Q3 41250 Y2007_04 40300 Y2008_Q1 47050 Y2008_Q2 47400 Y2008_Q3 42700 Y2008_94 42500 Y2009_01 39900 Y2009_Q2 40050 Y2009_03 40350 Y2009_04 39850 Y2010_01 38450 Y2010_02 39100 Y2010_Q3 38700 Y2010_04 38450 Y2011_01 37500 37500 37650 37300 36700 36300 Y2011_01 Y2011_02 Y2011_Q3 Y2011_04 Y2012_01 Y2012_Q2 Y2012_Q3 Y2012_04 Y2013_01 Y2013_02 Y2013_03 Y2013_04 Y2014_01 Y2014_Q2 Y2014_Q3 Y2014_24 Y2015_Q1 Y2015_Q2 35850 36100 35400 33550 34250 33550 33250 32800 33400 32750 32550 30450 31050Step by Step Solution
There are 3 Steps involved in it
Step: 1

Get Instant Access to Expert-Tailored Solutions
See step-by-step solutions with expert insights and AI powered tools for academic success
Step: 2

Step: 3

Ace Your Homework with AI
Get the answers you need in no time with our AI-driven, step-by-step assistance
Get Started


