Question
The quality control department of a fabric finishing plant is studying the effect of several factors on the dyeing of cottonsynthetic cloth used to manufacture
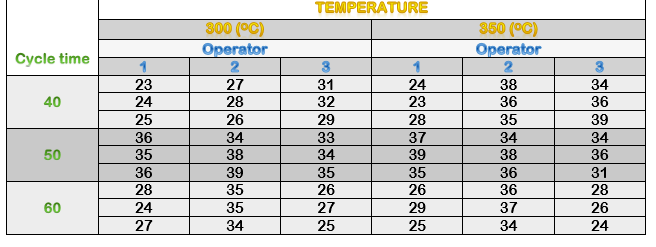
The quality control department of a fabric finishing plant is studying the effect of several factors on the dyeing of cottonsynthetic cloth used to manufacture mens shirts. Three operators, three cycle times, and two temperatures were selected, and three small specimens of cloth were dyed under each set of conditions. The finished cloth was compared to a standard, and a numerical score was assigned. The results are as follows

Define the variables, levels and response variable in this experiment. What are the hypotheses of interest in this test?
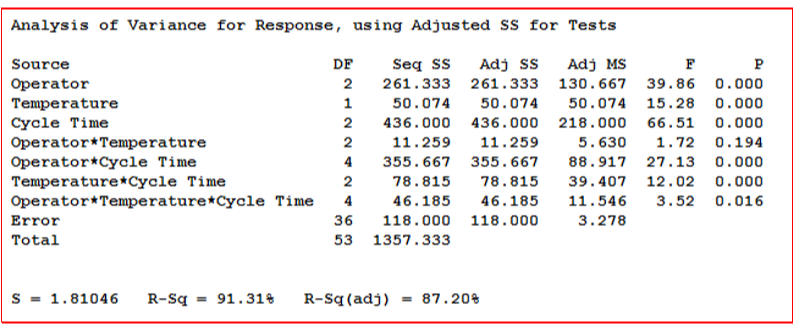
Analyze this factorial design and make conclusion based on P-values provided in the following table.

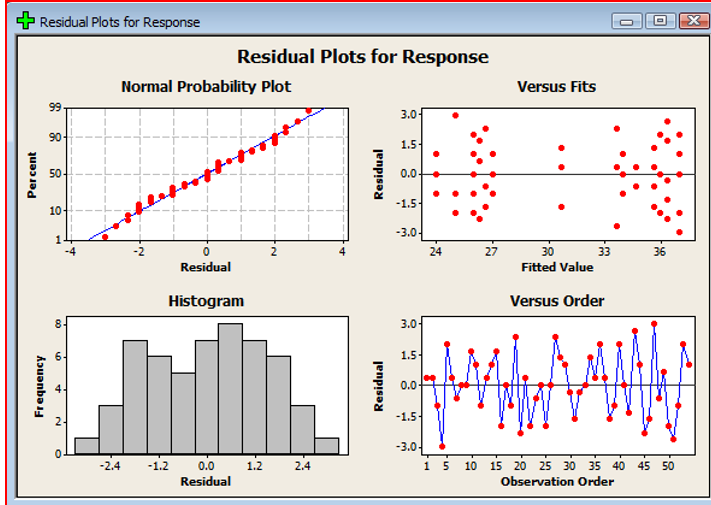
Check the models adequacy by commenting on the following plots

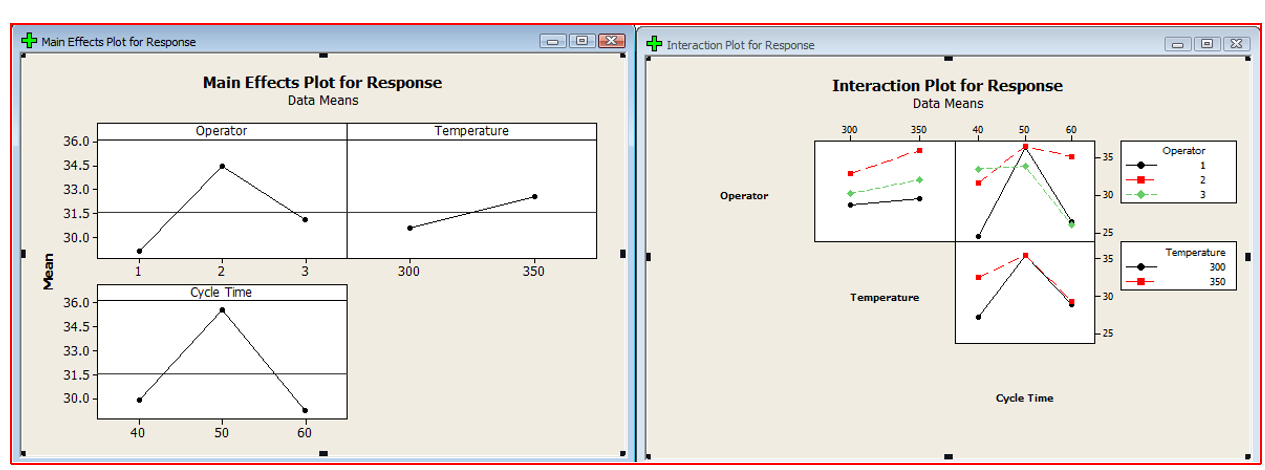
comment on the below factorial plot (main and interaction effect).

What is your recommendation to reach the higher score? (Operator?, Cycle time?, and temp level?)
TEMPERATURE 300 (C) Operator 2 350 (C) Operator Cycle time 23 31 38 24 23 28 32 29 34 28 37 36 39 34 36 34 39 24 25 36 35 36 28 24 27 35 31 28 39 35 35 34 26 27 25 35 26 29 25 26 37 34 24 Analysis of Variance for Response, using Adjusted ss for Tests Source Operator Temperature Cycle Time Operator Temperature Operator*Cycle Time Temperature Cycle Time Operator Temperature*Cycle Time Error Total Seq SS 261.333 50.074 436.000 2 11.259 4 355.667 78.815 4 46.185 36 118.000 53 1357.333 AN ANNEN Adj ss 261.333 50.074 436.000 11.259 355.667 78.815 46.185 118.000 Adj MS 130.667 39.86 50.074 15.28 218.000 66.51 5 .630 1.72 88.917 27.13 39.407 12.02 11.546 3.52 3.278 P 0.000 0.000 0.000 0.194 0.000 0.000 0.016 S = 1.81046 R-Sq = 91.314 R-Sq(adj) - 87.204 Residual Plots for Response DO x Residual Plots for Response Normal Probability Plot Versus Fits 90---- Percent 50+--- Residual 24 27 30 33 Fitted Value 36 Residual Histogram Versus Order Frequency Residual -3.0 -2.4 -1.2 0.0 Residual 1.2 2.4 i 5 10 15 20 25 30 35 40 45 50 Observation Order + Main Effects Plot for Response O o x Interaction Plot for Response Main Effects Plot for Response Data Means Interaction Plot for Response Data Means 300 350 40 50 60 Operator Temperature Operator 36.0 34.5 33.0- 31.5 Operator Mean 300 Temperature 300 350 Cycle Time 36.07 Temperature 34.5 33.0 31.5 30.0 Cycle Time TEMPERATURE 300 (C) Operator 2 350 (C) Operator Cycle time 23 31 38 24 23 28 32 29 34 28 37 36 39 34 36 34 39 24 25 36 35 36 28 24 27 35 31 28 39 35 35 34 26 27 25 35 26 29 25 26 37 34 24 Analysis of Variance for Response, using Adjusted ss for Tests Source Operator Temperature Cycle Time Operator Temperature Operator*Cycle Time Temperature Cycle Time Operator Temperature*Cycle Time Error Total Seq SS 261.333 50.074 436.000 2 11.259 4 355.667 78.815 4 46.185 36 118.000 53 1357.333 AN ANNEN Adj ss 261.333 50.074 436.000 11.259 355.667 78.815 46.185 118.000 Adj MS 130.667 39.86 50.074 15.28 218.000 66.51 5 .630 1.72 88.917 27.13 39.407 12.02 11.546 3.52 3.278 P 0.000 0.000 0.000 0.194 0.000 0.000 0.016 S = 1.81046 R-Sq = 91.314 R-Sq(adj) - 87.204 Residual Plots for Response DO x Residual Plots for Response Normal Probability Plot Versus Fits 90---- Percent 50+--- Residual 24 27 30 33 Fitted Value 36 Residual Histogram Versus Order Frequency Residual -3.0 -2.4 -1.2 0.0 Residual 1.2 2.4 i 5 10 15 20 25 30 35 40 45 50 Observation Order + Main Effects Plot for Response O o x Interaction Plot for Response Main Effects Plot for Response Data Means Interaction Plot for Response Data Means 300 350 40 50 60 Operator Temperature Operator 36.0 34.5 33.0- 31.5 Operator Mean 300 Temperature 300 350 Cycle Time 36.07 Temperature 34.5 33.0 31.5 30.0 Cycle Time
Step by Step Solution
There are 3 Steps involved in it
Step: 1

Get Instant Access to Expert-Tailored Solutions
See step-by-step solutions with expert insights and AI powered tools for academic success
Step: 2

Step: 3

Ace Your Homework with AI
Get the answers you need in no time with our AI-driven, step-by-step assistance
Get Started


