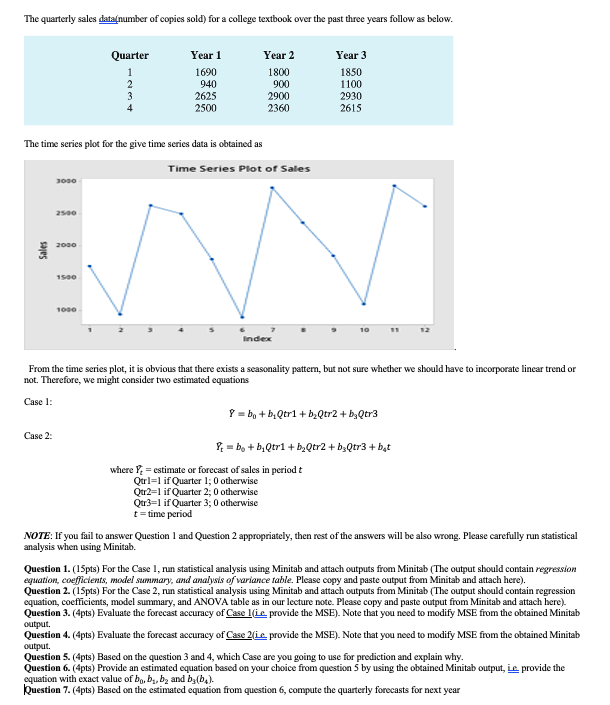
The quarterly sales data(number of copies sold) for a college textbook over the past three years follow as below. Quarter Year 1 Year 2 Year 3 1690 1800 1850 940 900 1100 2625 2900 2930 2500 2360 2615 The time series plot for the give time series data is obtained as Time Series Plot of Sales 1010 2540 inles 3090 1590 1090 Index 10 12 From the time series plot, it is obvious that there exists a seasonality pattern, but not sure whether we should have to incorporate linear trend or not. Therefore, we might consider two estimated equations Case 1: P = bo + b, Qtri + byQtr2 + byQtr3 Case 2: Y, = by + b, Qtri + byQtr2 + byQtr3 + bat where Pr = estimate or forecast of sales in period t Qurl=1 if Quarter 1; 0 otherwise Qur2=1 if Quarter 2; 0 otherwise Qu3=1 if Quarter 3; 0 otherwise t = time period NOTE: If you fail to answer Question I and Question 2 appropriately, then rest of the answers will be also wrong. Please carefully run statistical analysis when using Minitab Question 1. (15pts) For the Case I, run statistical analysis using Minitab and attach outputs from Minitab (The output should contain regression equation, coefficients, model summary, and analysis of variance fable. Please copy and paste output from Minitab and attach here). Question 2. (15pts) For the Case 2, run statistical analysis using Minitab and attach outputs from Minitab (The output should contain regression equation, coefficients, model summary, and ANOVA table as in our lecture note. Please copy and paste output from Minitab and attach here). Question 3. (4pts) Evaluate the forecast accuracy of Case I(in provide the MSE). Note that you need to modify MSE from the obtained Minitab output. Question 4. (4pts) Evaluate the forecast accuracy of Case 2(Le provide the MSE). Note that you need to modify MSE from the obtained Minitab output. Question 5. (4pts) Based on the question 3 and 4, which Case are you going to use for prediction and explain why. Question 6. (4pts) Provide an estimated equation based on your choice from question S by using the obtained Minitab output, in provide the equation with exact value of by, by, by and by (b,). Question 7. (4pts) Based on the estimated equation from question 6, compute the quarterly forecasts for next year


