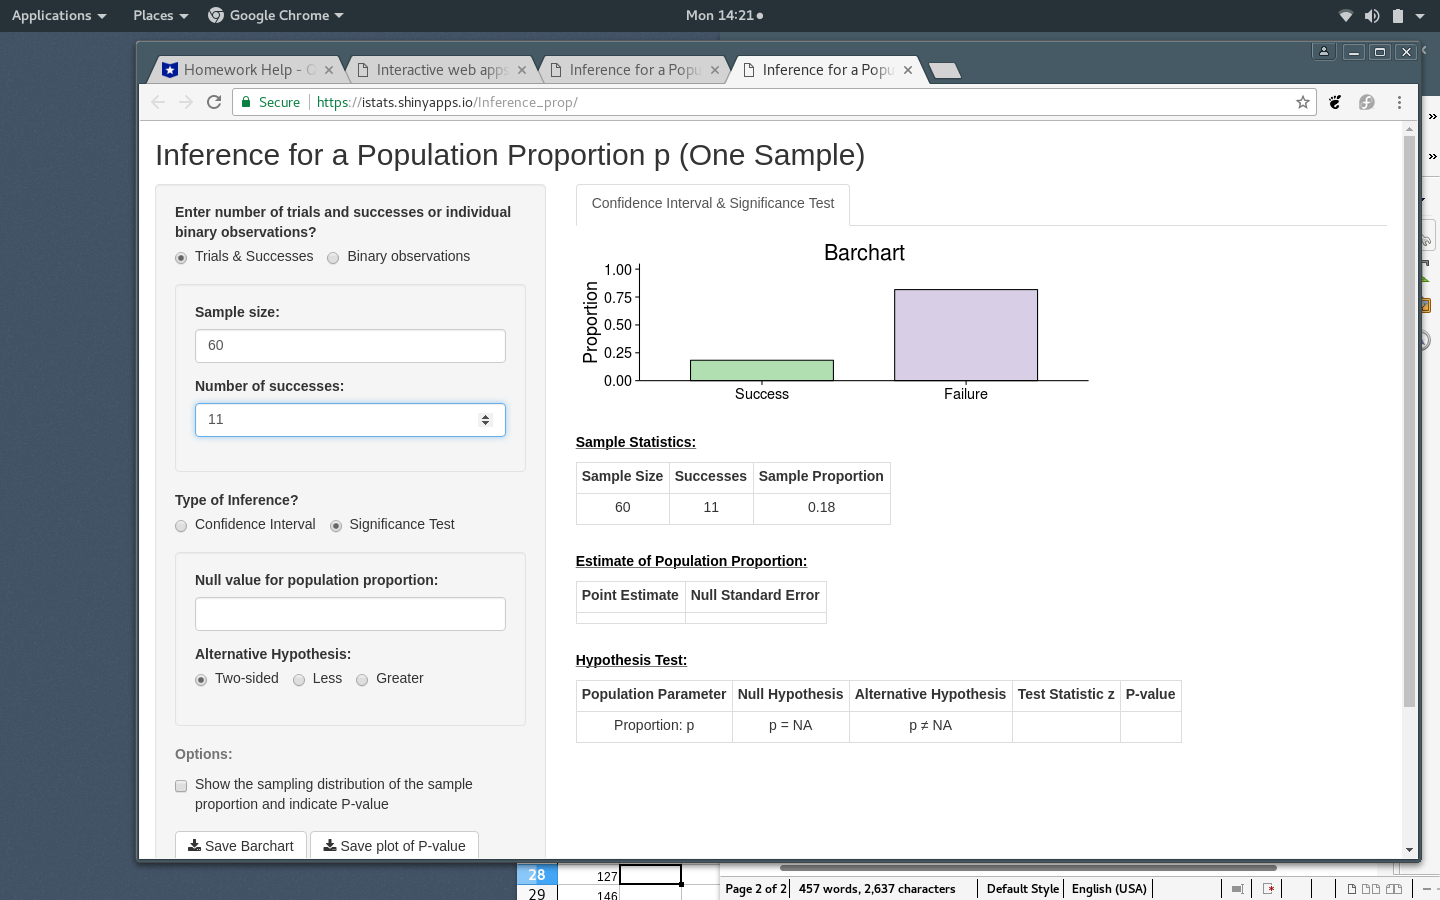
the question I am working on: Are less than 50% of the Islanders in debt?
Define the parameter.State the hypothesis. State and check the assumptions for a significance test for one proportion. Make sure to explain why the assumptions are met or not. State and clearly label the test statistic and the p-value.Interpret the p-value.
I also needthe null value for the population mean and the alternative hypothesis (two sided, less or greater) to input in to this statistics software package. The successes are yes to having debt
|l-3'L|ur-Jr"r-:V .5 I v u Homework Help( at D Interactive webapp: x D lnferenee foraPopL x D lnferenceforaPopr x C I 3 Secure I https h'lstats.shirlyalrlpsjorllnferenchrop.ll Inference for a Population Proportion p (One Sample) Confidence Interval It Signicance Test Enter number of triats and successes or individual binary observations? Q Trials &Suocesses Q Binary observations 1 GI} Barchart I: .Q 0.75 e 30.50 D i 0.25 Sample size: 60 Number of suocesses: 0.09 11 ' Sample Statistics: Sample Size Successes Sample Proportion Type of Inference? 50 11 0.18 Q Condence Interval @ Signicance Test Estimate o'l Population FroLortion: Null value for population proportion: Point Estimme Null standard Error Alternative Hypothesis: @ Two'sided Q Less Q Greater HIM Popuiation Parameter Null Hypothesis Alternative Hypothesis Test Statistic z P-value Proportlcn: p p = NA p 2 NA Options: Q Show the sampling dlstribulion ofthe sample proportion and indicate P-value & Save Bamhart .9. Save plot of Pavalue iFageZon 457worde,2,&31dlu'echm DefaultStyel swarms. l -Il E-| | | B mom - .aI-'-Iir...n.i.....v ' . ILIIr-Ji'te' (:3 MiniijectE-Sun" x Yourexperttutaron X D Inference foraPopi x C I 3 Secure I Https:His-tats.shinyappsloItferen:e,pmpf ' ' 9 ' @ Tnals {Successes Q Binary observannns 1 GO DHTC'I'IHTl - E . I 1% 0.?5 Sam esize: \" 30.50 a 5" i 0.25 . 0.00 Number of successes. Su Failure 11 Sample Statistics: Sample Size Successes Sample Proportion Type of Inference? Q Ccndeme Interval Signicance Test Null value for population proportion: .20 Alternative Hypothesis: @ Two-sided 0 Less Q Greater Options: C] Show the sampling distribution aflhe sample proportion and indicate Pevalue * Save Barchart 1. Save plot of P-vaiue 60 11 0.18 Estimate of Population Proportion: Point Estimate Null Standard Error 01833 0.0516 Hypothesis Test: Population Parameter Null Hypothesis Alternative Hypothesis Tbst Statistic z P-value Proportion: p p = 0.2 p t 0.2 70.3227 0.7469 Standard N ormal Distribution Ho: p = 0.2, Ha: p :6 0.2. Test Statistic: z = 41323, Pvalue = 0.7469 [).' {15 0.3734. 2' 1 loan-1 *3 *2 *1 0 1 2 3 70.323 0.323 Parameter is the aquantiy that characterises the population. In our case the parameter is 0.2. we assume that the the proportion of the population is 0.2. we can test the statistical significance of the claim that the population proportion is 0.20. The observed proportion is 11/60 =0.18 Null hypothesis H0: p =0.20 Alternative hypothesis H1: P is not equal to 0.20 z-value for single proportion where p is the observed proportion; pexp is the Null hypothesis (or expected) proportion; and se(p) is the standard error of the expected proportion: z statistic = (p - p exp)/ se (p) = (0.18 - 0.2)/ sqrt (pexp*1-pexp) = ( 0.18 - 0.2) / sqrt (0.2(1-0.2)/60) p value is 0.3734 using the z value z critical value 1.645 rejection region -1.645 1.645 we reject the null hypothesis since the p value 0.05 and conclude that at 0.05 level of sigificance, there exists insufficient statistical evidence that p=0.2 .aI-'-Iir...n.i.....v ' . ILIIr-Ji'te' (:3 MiniijectE-Sun" x Yourexperttutaron X D Inference foraPopi x C I 3 Secure I Https:His-tats.shinyappsloItferen:e,pmpf ' ' 9 ' @ Tnals {Successes Q Binary observannns 1 GO DHTC'I'IHTl - E . I 1% 0.?5 Sam esize: \" 30.50 a 5" i 0.25 . 0.00 Number of successes. Su Failure 11 Sample Statistics: Sample Size Successes Sample Proportion Type of Inference? Q Ccndeme Interval Signicance Test Null value for population proportion: .20 Alternative Hypothesis: @ Two-sided 0 Less Q Greater Options: C] Show the sampling distribution aflhe sample proportion and indicate Pevalue * Save Barchart 1. Save plot of P-vaiue 60 11 0.18 Estimate of Population Proportion: Point Estimate Null Standard Error 01833 0.0516 Hypothesis Test: Population Parameter Null Hypothesis Alternative Hypothesis Tbst Statistic z P-value Proportion: p p = 0.2 p t 0.2 70.3227 0.7469 Standard N ormal Distribution Ho: p = 0.2, Ha: p :6 0.2. Test Statistic: z = 41323, Pvalue = 0.7469 [).' {15 0.3734. 2' 1 loan-1 *3 *2 *1 0 1 2 3 70.323 0.323 Parameter is the aquantiy that characterises the population. In our case the parameter is 0.2. we assume that the the proportion of the population is 0.2. we can test the statistical significance of the claim that the population proportion is 0.20. The observed proportion is 11/60 =0.18 Null hypothesis H0: p =0.20 Alternative hypothesis H1: P is not equal to 0.20 z-value for single proportion where p is the observed proportion; pexp is the Null hypothesis (or expected) proportion; and se(p) is the standard error of the expected proportion: z statistic = (p - p exp)/ se (p) = (0.18 - 0.2)/ sqrt (pexp*1-pexp) = ( 0.18 - 0.2) / sqrt (0.2(1-0.2)/60) p value is 0.3734 using the z value z critical value 1.645 rejection region -1.645 1.645 we reject the null hypothesis since the p value 0.05 and conclude that at 0.05 level of sigificance, there exists insufficient statistical evidence that p=0.2


