Answered step by step
Verified Expert Solution
Link Copied!

Question

1 Approved Answer

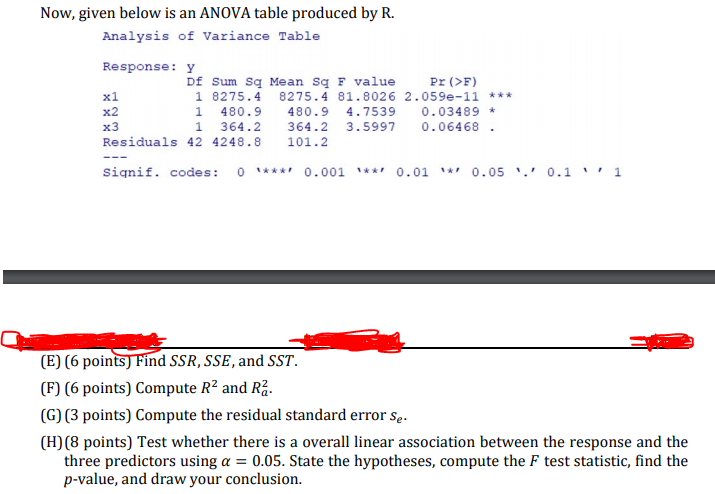
The question is below. Please show work to understand the process. Now, given below is an ANOVA table produced by R. Analysis of Variance Table

The question is below. Please show work to understand the process.

image text in transcribed
Now, given below is an ANOVA table produced by R. Analysis of Variance Table Response : Y Df Sum Sq Mean Sq F value Pr ()F) x1 1 8275.4 8275.4 81. 8026 2.059e-11 * * * x2 1 480.9 480.9 4.7539 0. 03489 * x3 1 364.2 364.2 3.5997 0. 06468 . Residuals 42 4248.8 101.2 Signif. codes: 0 '* * */ 0.001 * */ 0.01 " *' 0. 05 ' .' 0.1 ' ' 1 2 (E) (6 points] Find SSR, SSE, and SST. (F) (6 points) Compute R2 and Ra. (G) (3 points) Compute the residual standard error Se. (H) (8 points) Test whether there is a overall linear association between the response and the three predictors using a = 0.05. State the hypotheses, compute the F test statistic, find the p-value, and draw your conclusion

Step by Step Solution

There are 3 Steps involved in it

Step: 1

blur-text-image

Get Instant Access to Expert-Tailored Solutions

See step-by-step solutions with expert insights and AI powered tools for academic success

Step: 2

blur-text-image

Step: 3

blur-text-image

Ace Your Homework with AI

Get the answers you need in no time with our AI-driven, step-by-step assistance

Get Started

Recommended Textbook for

More Books

Students also viewed these Mathematics questions

Question

What type of community do I enjoy working in?

Answered: 1 week ago

Question

2. Are you varying your pitch (to avoid being monotonous)?

Answered: 1 week ago

Question

3. Are you varying your speaking rate and volume?

Answered: 1 week ago