Answered step by step
Verified Expert Solution
Question
1 Approved Answer
THE QUESTION IS NOT BLURRED SOMEONE PLEASE JUST HELP ME. THIS IS THE 5TH TIME I'VE POSTED THIS. LOOK AT IT ON YOUT PHONE OR
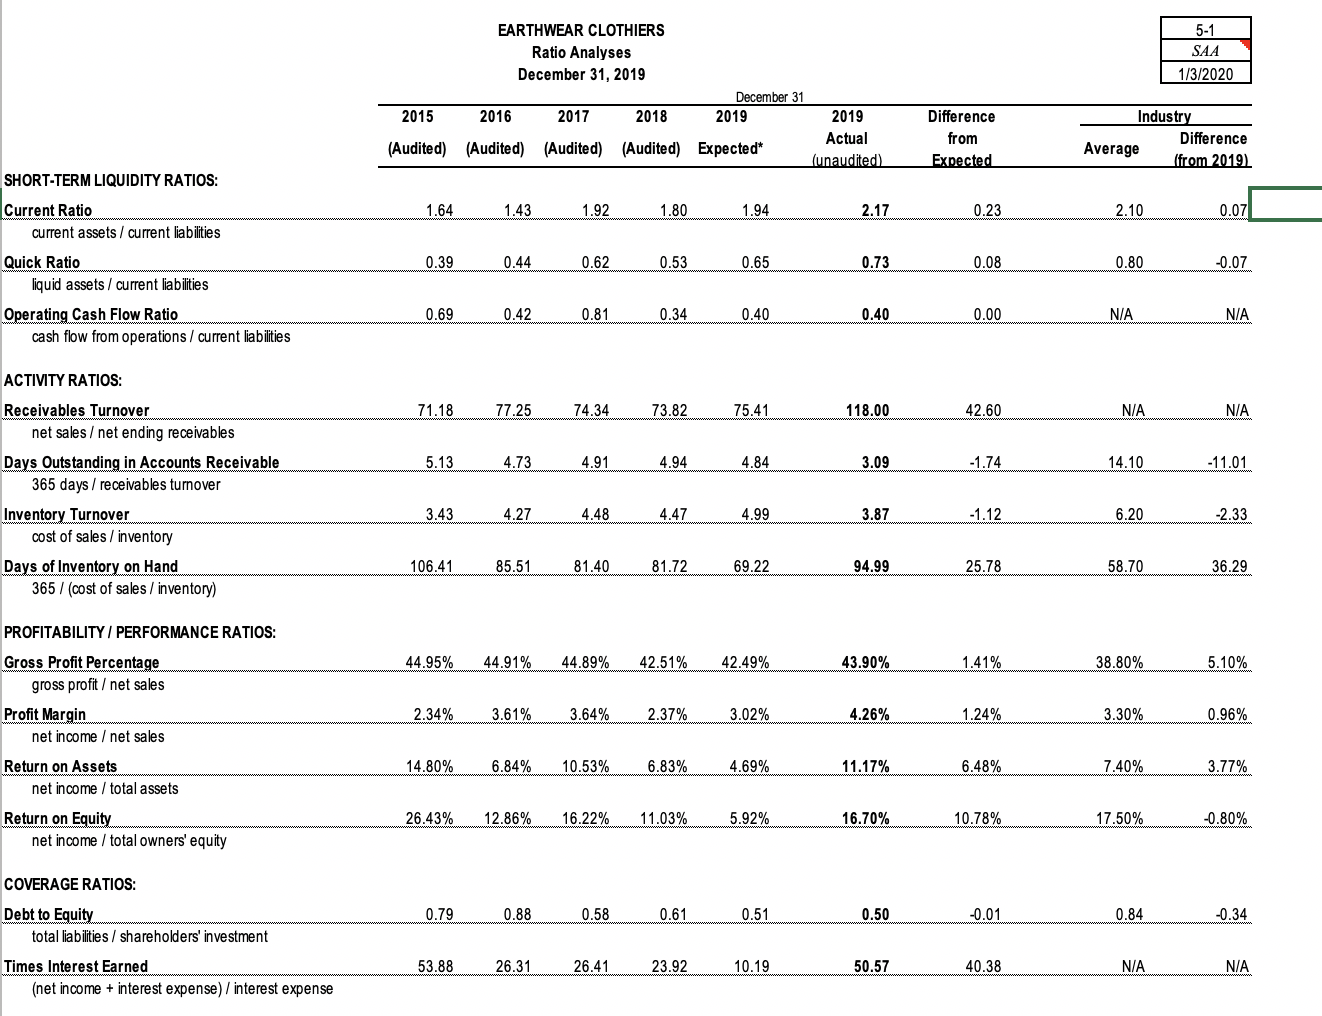
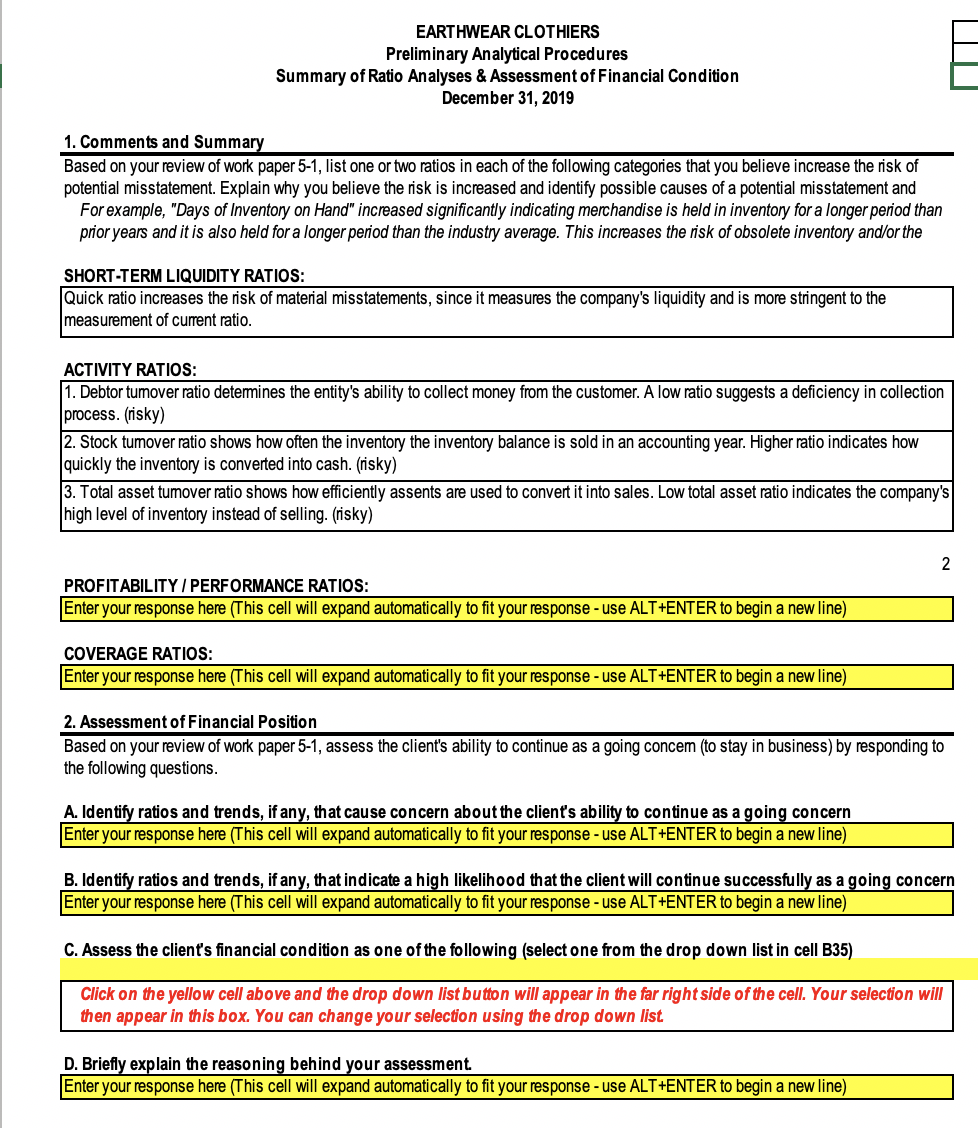
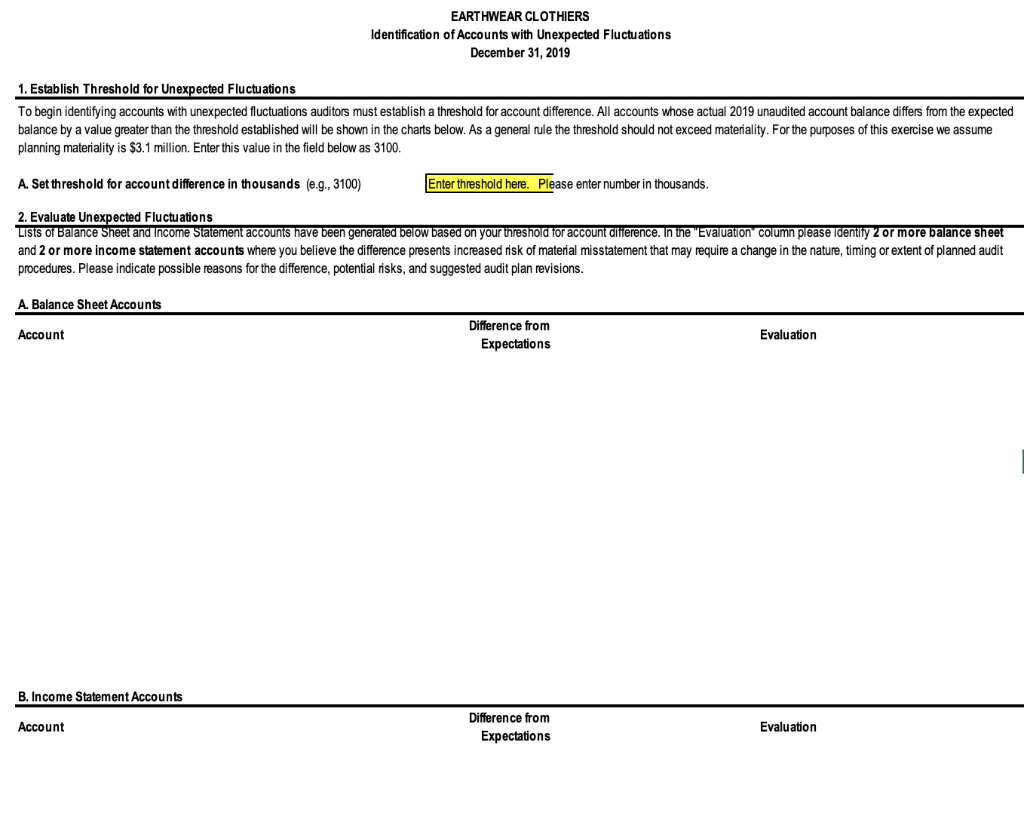
THE QUESTION IS NOT BLURRED SOMEONE PLEASE JUST HELP ME. THIS IS THE 5TH TIME I'VE POSTED THIS. LOOK AT IT ON YOUT PHONE OR SOMETHING.
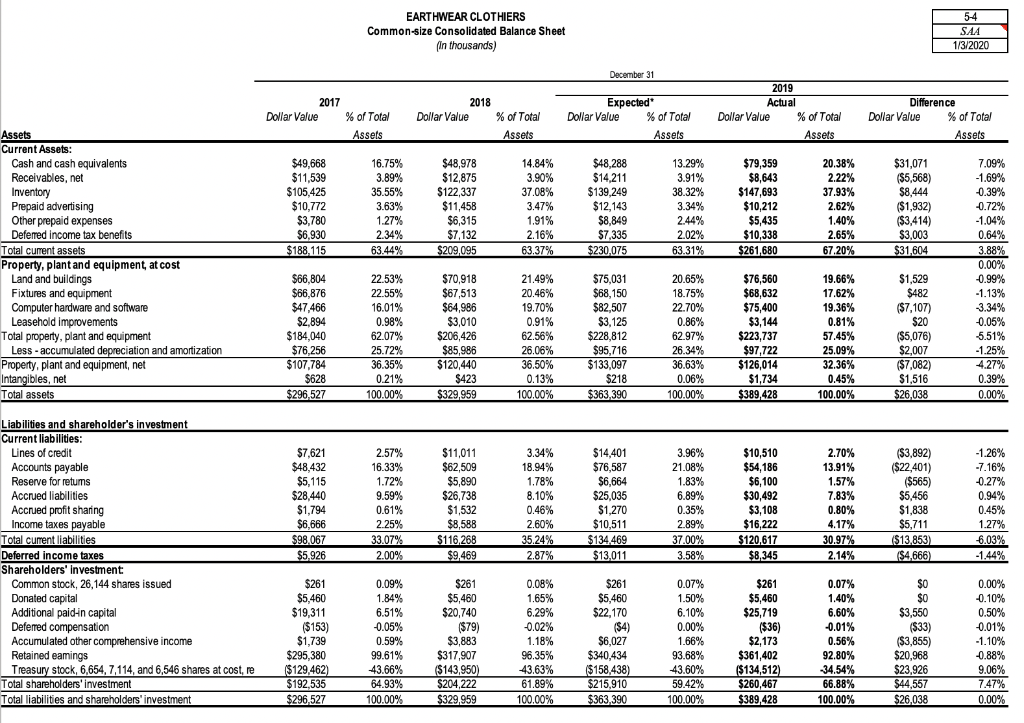
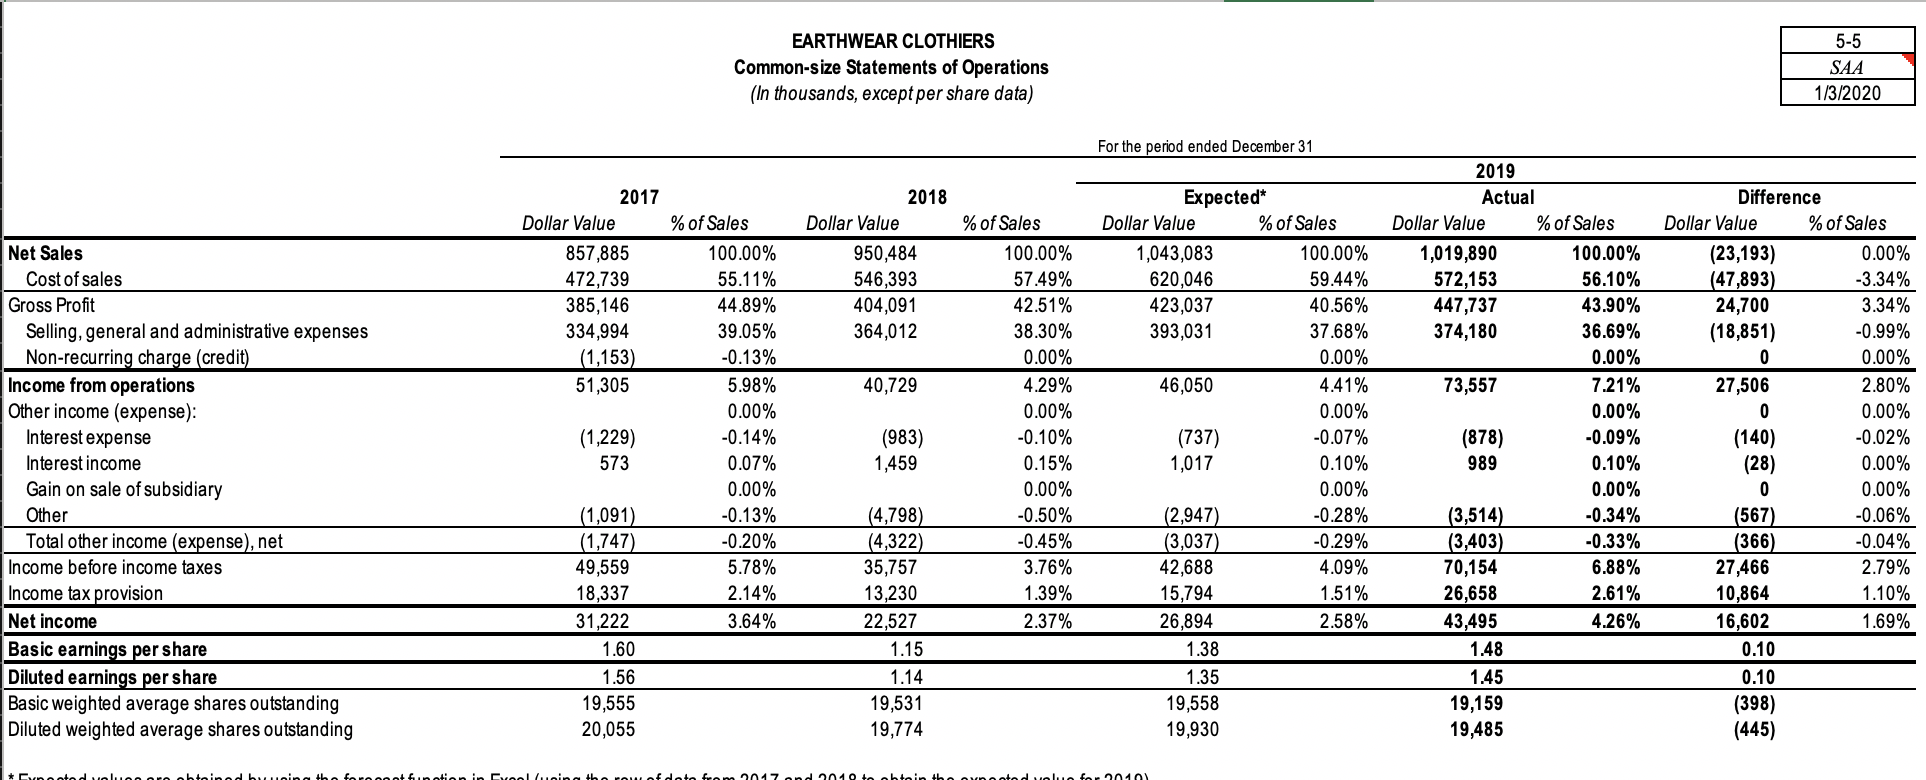
5-1 SAA 1/3/2020 EARTHWEAR CLOTHIERS Ratio Analyses December 31, 2019 December 31 2015 2016 2017 2018 2019 2019 Actual (Audited) (Audited) (Audited) (Audited) Expected* (unaudited) Difference from Expected Industry Difference Average (from 2019) SHORT-TERM LIQUIDITY RATIOS: 1.64 1.43 1.92 1.80 1.94 2.17 0.23 2.10 0.07 Current Ratio current assets / current liabilities 0.39 0.44 0.62 0.53 0.65 0.73 0.08 0.80 -0.07 Quick Ratio liquid assets/ current liabilities Operating Cash Flow Ratio cash flow from operations / current liabilities 0.69 0.42 0.81 0.34 0.40 0.40 0.00 N/A N/A ACTIVITY RATIOS: 71.18 77.25 74.34 73.82 75.41 118.00 42.60 N/A N/A 5.13 4.91 4.94 4.84 3.09 1.74 14.10 -11.01 Receivables Turnover net sales / net ending receivables Days Outstanding in Accoun Receivable 365 days / receivables turnover Inventory Turnover cost of sales / inventory Days of Inventory on Hand 365 / (cost of sales / inventory) 3.43 4.27 4.48 4.47 4.99 3.87 -1.12 6.20 -2.33 106.41 85.51 81.40 81.72 69.22 94.99 25.78 58.70 36.29 44.95% 44.91% 44.89% 42.51% 42.49% 43.90% 1.41% 38.80% 5.10% PROFITABILITY / PERFORMANCE RATIOS: Gross Profit Percentage gross profit/ net sales Profit Margin net income / net sales 2.34% 3.61% 3.64% 2.37% 3.02% 4.26% 1.24% 3.30% 0.96% 14.80% 6.84% 10.53% 6.83% 4.69% 11.17% 6.48% 7.40% 3.77% Return on Assets net income / total assets 26.43% 12.86% 16.22% 11.03% 5.92% 16.70% 10.78% 17.50% -0.80% Return on Equity net income / total owners' equity COVERAGE RATIOS: 0.79 0.88 0.58 0.61 0.51 0.50 -0.01 0.84 -0.34 Debt to Equity total liabilities / shareholders' investment Times Interest Earned (net income + interest expense) / interest expense 53.88 26.31 26.41 23.92 10.19 50.57 40.38 N/A N/A EARTHWEAR CLOTHIERS Preliminary Analytical Procedures Summary of Ratio Analyses & Assessment of Financial Condition December 31, 2019 1. Comments and Summary Based on your review of work paper 5-1, list one or two ratios in each of the following categories that you believe increase the risk of potential misstatement. Explain why you believe the risk is increased and identify possible causes of a potential misstatement and For example, "Days of Inventory on Hand" increased significantly indicating merchandise is held in inventory for a longer period than prior years and it is also held for a longer period than the industry average. This increases the risk of obsolete inventory and/or the SHORT-TERM LIQUIDITY RATIOS: Quick ratio increases the risk of material misstatements, since it measures the company's liquidity and is more stringent to the measurement of current ratio. ACTIVITY RATIOS: 1. Debtor tumover ratio determines the entity's ability to collect money from the customer. A low ratio suggests a deficiency in collection process. (risky) 2. Stock tumover ratio shows how often the inventory the inventory balance is sold in an accounting year. Higher ratio indicates how quickly the inventory is converted into cash. (risky) 3. Total asset tumover ratio shows how efficiently assents are used to convert it into sales. Low total asset ratio indicates the company's high level of inventory instead of selling. (risky) 2 PROFITABILITY / PERFORMANCE RATIOS: Enter your response here (This cell will expand automatically to fit your response - use ALT+ENTER to begin a new line) COVERAGE RATIOS: Enter your response here (This cell will expand automatically to fit your response - use ALT+ENTER to begin a new line) 2. Assessment of Financial Position Based on your review of work paper 5-1, assess the client's ability to continue as a going concem (to stay in business) by responding to the following questions. A. Identify ratios and trends, if any, that cause concern about the client's ability to continue as a going concern Enter your response here (This cell will expand automatically to fit your response - use ALT+ENTER to begin a new line) B. Identify ratios and trends, if any, that indicate a high likelihood that the client will continue successfully as a going concern Enter your response here (This cell will expand automatically to fit your response - use ALT+ENTER to begin a new line) C. Assess the client's financial condition as one of the following (select one from the drop down list in cell B35) Click on the yellow cell above and the drop down list button will appear in the far right side of the cell. Your selection will then appear in this box. You can change your selection using the drop down list D. Briefly explain the reasoning behind your assessment Enter your response here (This cell will expand automatically to fit your response - use ALT+ENTER to begin a new line) EARTHWEAR CLOTHIERS Identification of Accounts with Unexpected Fluctuations December 31, 2019 1. Establish Threshold for Unexpected Fluctuations To begin identifying accounts with unexpected fluctuations auditors must establish a threshold for account difference. All accounts whose actual 2019 unaudited account balance differs from the expected balance by a value greater than the threshold established will be shown in the charts below. As a general rule the threshold should not exceed materiality. For the purposes of this exercise we assume planning materiality is $3.1 million. Enter this value in the field below as 3100. A. Set threshold for account difference thousands (e.g., 3100) Enter threshold here. Please enter number in thousands. 2. Evaluate Unexpected Fluctuations Lists of Balance sheet and income statement accounts have been generated below based on your inreshold for account difference. In the "Evaluation Column please identity 2 or more balance sheet and 2 or more income statement accounts where you believe the difference presents increased risk of material misstatement that may require a change in the nature, timing or extent of planned audit procedures. Please indicate possible reasons for the difference, potential risks, and suggested audit plan revisions. A. Balance Sheet Accounts Account Difference from Expectations Evaluation B. Income Statement Accounts Account Difference from Expectations Evaluation 5-4 EARTHWEAR CLOTHIERS Common-size Consolidated Balance Sheet (in thousands) SAA 1/3/2020 December 31 2017 Dollar Value 2018 Dollar Value % of Total Assets % of Total Assets Expected Dollar Value % of Total Assets 2019 Actual Dollar Value % of Total Assets Difference Dollar Value % of Total Assets 14.84% 3.90% 37.08% $49,668 $11,539 $105,425 $10,772 $3,780 $6,930 $188,115 16.75% 3.89% 35.55% 3.63% 1.27% 2.34% 63.44% $48,978 $12,875 $122,337 $11,458 $6,315 $7,132 $209,095 3.47% 1.91% 2.16% 63.37% $48,288 $14,211 $139,249 $12,143 $8,849 $7,335 $230,075 13.29% 3.91% 38.32% 3.34% 2.44% 2.02% 63.31% $79,359 $8,643 $147,693 $10,212 $5,435 $10,338 $261,680 20.38% 2.22% 37.93% 2.62% 1.40% 2.65% 67.20% $31,071 ($5,568) $8,444 ($1,932) ($3,414) $3,003 $31,604 Assets Current Assets: Cash and cash equivalents Receivables, net Inventory Prepaid advertising Other prepaid expenses Deferred income tax benefits Total current assets Property, plant and equipment at cost Land and buildings Fixtures and equipment Computer hardware and software Leasehold improvements Total property, plant and equipment Less - accumulated depreciation and amortization Property, plant and equipment, net Intangibles, net Total assets $70,918 $67,513 $64,986 $3,010 $66,804 $66,876 $47,466 $2,894 $184,040 $76,256 $107,784 $628 $296,527 22.53% 22.55% 16.01% 0.98% 62.07% 25.72% 36.35% 0.21% 100.00% 21.49% 20.46% 19.70% 0.91% 62.56% 26.06% 36.50% 0.13% 100.00% $206,426 $75,031 $68,150 $82,507 $3,125 $228,812 $95,716 $133,097 $218 $363,390 20.65% 18.75% 22.70% 0.86% 62.97% 26.34% 36.63% 0.06% 100.00% $76,560 $68,632 $75,400 $3,144 $223,737 $97,722 $126,014 $1,734 $389,428 19.66% 17.62% 19.36% 0.81% 57.45% 25.09% 32.36% 0.45% 100.00% 7.09% -1.69% -0.39% -0.72% -1.04% 0.64% 3.88% 0.00% -0.99% -1.13% 3.34% 0.05% 5.51% -1.25% 4.27% 0.39% 0.00% $1,529 $482 ($7,107) $20 ($5,076) $2,007 ($7,082) $1,516 $26,038 $85,986 $120,440 $423 $329,959 $7,621 $48,432 $5,115 $28,440 $1,794 $6,666 $98.067 $5.926 2.57% 16.33% 1.72% 9.59% 0.61% 2.25% 33.07% 2.00% $11,011 $62,509 $5,890 $26,738 $1,532 $8,588 $116,268 $9,469 3.34% 18.94% 1.78% 8.10% 0.46% 2.60% 35.24% 2.87% $14,401 $76,587 $6,664 $25,035 $1.270 $10,511 $134.469 $13.011 3.96% 21.08% 1.83% 6.89% 0.35% 2.89% 37.00% 3.58% $10,510 $54,186 $6,100 $30,492 $3,108 $16.222 $120,617 $8,345 2.70% 13.91% 1.57% 7.83% 0.80% 4.17% 30.97% 2.14% ($3,892) ($22,401) ($565) $5,456 $1,838 $5,711 ($13,853) -1.26% -7.16% -0.27% 0.94% 0.45% 1.27% 6.03% -1.44% $4.666) Liabilities and shareholder's investment Current liabilities: Lines of credit Accounts payable Reserve for retums Accrued liabilities Accrued profit sharing Income taxes payable Total cument liabilities Deferred income taxes Shareholders' Investment Common stock, 26,144 shares issued Donated capital Additional paid-in capital Deferred compensation Accumulated other comprehensive income Retained eamings Treasury stock, 6,654,7,114, and 6,546 shares at cost, re Total shareholders'investment Total liabilities and shareholders'investment $261 $5,460 $19,311 ($153) $1,739 $295,380 $129,462) $192,535 $296,527 0.09% 1.84% 6.51% -0.05% 0.59% 99.61% 43.66% 64.93% 100.00% $261 $5,460 $20,740 (579) $3,883 $317,907 ($143,950) $204,222 $329,959 0.08% 1.65% 6.29% 0.02% 1.18% 96.35% 43.63% 61.89% 100.00% $261 $5,460 $22,170 (54) $6,027 $340,434 ($158,438) $215,910 $363,390 0.07% 1.50% 6.10% 0.00% 1.66% 93.68% 43.60% 59.42% 100.00% $261 $5,460 $25,719 ($36) $2,173 $361,402 ($134,512) $260,467 $389,428 0.07% 1.40% 6,60% -0.01% 0.56% 92.80% -34.54% 66.88% 100.00% $0 $0 $3,550 (533) ($3,855) $20,968 $23,926 $44,557 $26,038 0.00% -0.10% 0.50% -0.01% -1.10% -0.88% 9.06% 7.47% 0.00% EARTHWEAR CLOTHIERS Common-size Statements of Operations (In thousands, except per share data) 5-5 SAA 1/3/2020 For the period ended December 31 2017 Dollar Value 857,885 472,739 385,146 334,994 (1,153) 51,305 2018 Dollar Value 950,484 546,393 404,091 364,012 40,729 % of Sales 100.00% 55.11% 44.89% 39.05% -0.13% 5.98% 0.00% -0.14% 0.07% 0.00% -0.13% -0.20% 5.78% 2.14% 3.64% % of Sales 100.00% 57.49% 42.51% 38.30% 0.00% 4.29% 0.00% -0.10% 0.15% 0.00% -0.50% -0.45% 3.76% 1.39% 2.37% Net Sales Cost of sales Gross Profit Selling, general and administrative expenses Non-recurring charge (credit) Income from operations Other income (expense): Interest expense Interest income Gain on sale of subsidiary Other Total other income (expense), net Income before income taxes Income tax provision Net income Basic earnings per share Diluted earnings per share Basic weighted average shares outstanding Diluted weighted average shares outstanding (1,229) 573 2019 Actual Dollar Value % of Sales 1,019,890 100.00% 572,153 56.10% 447,737 43.90% 374,180 36.69% 0.00% 73,557 7.21% 0.00% (878) -0.09% 989 0.10% 0.00% (3,514) -0.34% (3,403) -0.33% 70,154 6.88% 26,658 2.61% 43,495 4.26% 1.48 (983) 1,459 Expected* Dollar Value % of Sales 1,043,083 100.00% 620,046 59.44% 423,037 40.56% 393,031 37.68% 0.00% 46,050 4.41% 0.00% (737) -0.07% 1,017 0.10% 0.00% (2,947) -0.28% (3,037) -0.29% 42,688 4.09% 15,794 1.51% 26,894 2.58% 1.38 1.35 19,558 19,930 Difference Dollar Value % of Sales (23,193) 0.00% (47,893) -3.34% 24,700 3.34% (18,851) -0.99% 0 0.00% 27,506 2.80% 0 0.00% (140) -0.02% (28) 0.00% 0 0.00% (567) -0.06% (366) -0.04% 27,466 2.79% 10,864 1.10% 16,602 1.69% 0.10 0.10 (398) (445) (1,091) (1,747) 49,559 18,337 31,222 1.60 1.56 19,555 20,055 (4,798) (4,322) 35,757 13,230 22,527 1.15 1.14 19,531 19,774 1.45 19,159 19,485 luon or obtained by a from 2017 and 10 to dolo for 2010 5-1 SAA 1/3/2020 EARTHWEAR CLOTHIERS Ratio Analyses December 31, 2019 December 31 2015 2016 2017 2018 2019 2019 Actual (Audited) (Audited) (Audited) (Audited) Expected* (unaudited) Difference from Expected Industry Difference Average (from 2019) SHORT-TERM LIQUIDITY RATIOS: 1.64 1.43 1.92 1.80 1.94 2.17 0.23 2.10 0.07 Current Ratio current assets / current liabilities 0.39 0.44 0.62 0.53 0.65 0.73 0.08 0.80 -0.07 Quick Ratio liquid assets/ current liabilities Operating Cash Flow Ratio cash flow from operations / current liabilities 0.69 0.42 0.81 0.34 0.40 0.40 0.00 N/A N/A ACTIVITY RATIOS: 71.18 77.25 74.34 73.82 75.41 118.00 42.60 N/A N/A 5.13 4.91 4.94 4.84 3.09 1.74 14.10 -11.01 Receivables Turnover net sales / net ending receivables Days Outstanding in Accoun Receivable 365 days / receivables turnover Inventory Turnover cost of sales / inventory Days of Inventory on Hand 365 / (cost of sales / inventory) 3.43 4.27 4.48 4.47 4.99 3.87 -1.12 6.20 -2.33 106.41 85.51 81.40 81.72 69.22 94.99 25.78 58.70 36.29 44.95% 44.91% 44.89% 42.51% 42.49% 43.90% 1.41% 38.80% 5.10% PROFITABILITY / PERFORMANCE RATIOS: Gross Profit Percentage gross profit/ net sales Profit Margin net income / net sales 2.34% 3.61% 3.64% 2.37% 3.02% 4.26% 1.24% 3.30% 0.96% 14.80% 6.84% 10.53% 6.83% 4.69% 11.17% 6.48% 7.40% 3.77% Return on Assets net income / total assets 26.43% 12.86% 16.22% 11.03% 5.92% 16.70% 10.78% 17.50% -0.80% Return on Equity net income / total owners' equity COVERAGE RATIOS: 0.79 0.88 0.58 0.61 0.51 0.50 -0.01 0.84 -0.34 Debt to Equity total liabilities / shareholders' investment Times Interest Earned (net income + interest expense) / interest expense 53.88 26.31 26.41 23.92 10.19 50.57 40.38 N/A N/A EARTHWEAR CLOTHIERS Preliminary Analytical Procedures Summary of Ratio Analyses & Assessment of Financial Condition December 31, 2019 1. Comments and Summary Based on your review of work paper 5-1, list one or two ratios in each of the following categories that you believe increase the risk of potential misstatement. Explain why you believe the risk is increased and identify possible causes of a potential misstatement and For example, "Days of Inventory on Hand" increased significantly indicating merchandise is held in inventory for a longer period than prior years and it is also held for a longer period than the industry average. This increases the risk of obsolete inventory and/or the SHORT-TERM LIQUIDITY RATIOS: Quick ratio increases the risk of material misstatements, since it measures the company's liquidity and is more stringent to the measurement of current ratio. ACTIVITY RATIOS: 1. Debtor tumover ratio determines the entity's ability to collect money from the customer. A low ratio suggests a deficiency in collection process. (risky) 2. Stock tumover ratio shows how often the inventory the inventory balance is sold in an accounting year. Higher ratio indicates how quickly the inventory is converted into cash. (risky) 3. Total asset tumover ratio shows how efficiently assents are used to convert it into sales. Low total asset ratio indicates the company's high level of inventory instead of selling. (risky) 2 PROFITABILITY / PERFORMANCE RATIOS: Enter your response here (This cell will expand automatically to fit your response - use ALT+ENTER to begin a new line) COVERAGE RATIOS: Enter your response here (This cell will expand automatically to fit your response - use ALT+ENTER to begin a new line) 2. Assessment of Financial Position Based on your review of work paper 5-1, assess the client's ability to continue as a going concem (to stay in business) by responding to the following questions. A. Identify ratios and trends, if any, that cause concern about the client's ability to continue as a going concern Enter your response here (This cell will expand automatically to fit your response - use ALT+ENTER to begin a new line) B. Identify ratios and trends, if any, that indicate a high likelihood that the client will continue successfully as a going concern Enter your response here (This cell will expand automatically to fit your response - use ALT+ENTER to begin a new line) C. Assess the client's financial condition as one of the following (select one from the drop down list in cell B35) Click on the yellow cell above and the drop down list button will appear in the far right side of the cell. Your selection will then appear in this box. You can change your selection using the drop down list D. Briefly explain the reasoning behind your assessment Enter your response here (This cell will expand automatically to fit your response - use ALT+ENTER to begin a new line) EARTHWEAR CLOTHIERS Identification of Accounts with Unexpected Fluctuations December 31, 2019 1. Establish Threshold for Unexpected Fluctuations To begin identifying accounts with unexpected fluctuations auditors must establish a threshold for account difference. All accounts whose actual 2019 unaudited account balance differs from the expected balance by a value greater than the threshold established will be shown in the charts below. As a general rule the threshold should not exceed materiality. For the purposes of this exercise we assume planning materiality is $3.1 million. Enter this value in the field below as 3100. A. Set threshold for account difference thousands (e.g., 3100) Enter threshold here. Please enter number in thousands. 2. Evaluate Unexpected Fluctuations Lists of Balance sheet and income statement accounts have been generated below based on your inreshold for account difference. In the "Evaluation Column please identity 2 or more balance sheet and 2 or more income statement accounts where you believe the difference presents increased risk of material misstatement that may require a change in the nature, timing or extent of planned audit procedures. Please indicate possible reasons for the difference, potential risks, and suggested audit plan revisions. A. Balance Sheet Accounts Account Difference from Expectations Evaluation B. Income Statement Accounts Account Difference from Expectations Evaluation 5-4 EARTHWEAR CLOTHIERS Common-size Consolidated Balance Sheet (in thousands) SAA 1/3/2020 December 31 2017 Dollar Value 2018 Dollar Value % of Total Assets % of Total Assets Expected Dollar Value % of Total Assets 2019 Actual Dollar Value % of Total Assets Difference Dollar Value % of Total Assets 14.84% 3.90% 37.08% $49,668 $11,539 $105,425 $10,772 $3,780 $6,930 $188,115 16.75% 3.89% 35.55% 3.63% 1.27% 2.34% 63.44% $48,978 $12,875 $122,337 $11,458 $6,315 $7,132 $209,095 3.47% 1.91% 2.16% 63.37% $48,288 $14,211 $139,249 $12,143 $8,849 $7,335 $230,075 13.29% 3.91% 38.32% 3.34% 2.44% 2.02% 63.31% $79,359 $8,643 $147,693 $10,212 $5,435 $10,338 $261,680 20.38% 2.22% 37.93% 2.62% 1.40% 2.65% 67.20% $31,071 ($5,568) $8,444 ($1,932) ($3,414) $3,003 $31,604 Assets Current Assets: Cash and cash equivalents Receivables, net Inventory Prepaid advertising Other prepaid expenses Deferred income tax benefits Total current assets Property, plant and equipment at cost Land and buildings Fixtures and equipment Computer hardware and software Leasehold improvements Total property, plant and equipment Less - accumulated depreciation and amortization Property, plant and equipment, net Intangibles, net Total assets $70,918 $67,513 $64,986 $3,010 $66,804 $66,876 $47,466 $2,894 $184,040 $76,256 $107,784 $628 $296,527 22.53% 22.55% 16.01% 0.98% 62.07% 25.72% 36.35% 0.21% 100.00% 21.49% 20.46% 19.70% 0.91% 62.56% 26.06% 36.50% 0.13% 100.00% $206,426 $75,031 $68,150 $82,507 $3,125 $228,812 $95,716 $133,097 $218 $363,390 20.65% 18.75% 22.70% 0.86% 62.97% 26.34% 36.63% 0.06% 100.00% $76,560 $68,632 $75,400 $3,144 $223,737 $97,722 $126,014 $1,734 $389,428 19.66% 17.62% 19.36% 0.81% 57.45% 25.09% 32.36% 0.45% 100.00% 7.09% -1.69% -0.39% -0.72% -1.04% 0.64% 3.88% 0.00% -0.99% -1.13% 3.34% 0.05% 5.51% -1.25% 4.27% 0.39% 0.00% $1,529 $482 ($7,107) $20 ($5,076) $2,007 ($7,082) $1,516 $26,038 $85,986 $120,440 $423 $329,959 $7,621 $48,432 $5,115 $28,440 $1,794 $6,666 $98.067 $5.926 2.57% 16.33% 1.72% 9.59% 0.61% 2.25% 33.07% 2.00% $11,011 $62,509 $5,890 $26,738 $1,532 $8,588 $116,268 $9,469 3.34% 18.94% 1.78% 8.10% 0.46% 2.60% 35.24% 2.87% $14,401 $76,587 $6,664 $25,035 $1.270 $10,511 $134.469 $13.011 3.96% 21.08% 1.83% 6.89% 0.35% 2.89% 37.00% 3.58% $10,510 $54,186 $6,100 $30,492 $3,108 $16.222 $120,617 $8,345 2.70% 13.91% 1.57% 7.83% 0.80% 4.17% 30.97% 2.14% ($3,892) ($22,401) ($565) $5,456 $1,838 $5,711 ($13,853) -1.26% -7.16% -0.27% 0.94% 0.45% 1.27% 6.03% -1.44% $4.666) Liabilities and shareholder's investment Current liabilities: Lines of credit Accounts payable Reserve for retums Accrued liabilities Accrued profit sharing Income taxes payable Total cument liabilities Deferred income taxes Shareholders' Investment Common stock, 26,144 shares issued Donated capital Additional paid-in capital Deferred compensation Accumulated other comprehensive income Retained eamings Treasury stock, 6,654,7,114, and 6,546 shares at cost, re Total shareholders'investment Total liabilities and shareholders'investment $261 $5,460 $19,311 ($153) $1,739 $295,380 $129,462) $192,535 $296,527 0.09% 1.84% 6.51% -0.05% 0.59% 99.61% 43.66% 64.93% 100.00% $261 $5,460 $20,740 (579) $3,883 $317,907 ($143,950) $204,222 $329,959 0.08% 1.65% 6.29% 0.02% 1.18% 96.35% 43.63% 61.89% 100.00% $261 $5,460 $22,170 (54) $6,027 $340,434 ($158,438) $215,910 $363,390 0.07% 1.50% 6.10% 0.00% 1.66% 93.68% 43.60% 59.42% 100.00% $261 $5,460 $25,719 ($36) $2,173 $361,402 ($134,512) $260,467 $389,428 0.07% 1.40% 6,60% -0.01% 0.56% 92.80% -34.54% 66.88% 100.00% $0 $0 $3,550 (533) ($3,855) $20,968 $23,926 $44,557 $26,038 0.00% -0.10% 0.50% -0.01% -1.10% -0.88% 9.06% 7.47% 0.00% EARTHWEAR CLOTHIERS Common-size Statements of Operations (In thousands, except per share data) 5-5 SAA 1/3/2020 For the period ended December 31 2017 Dollar Value 857,885 472,739 385,146 334,994 (1,153) 51,305 2018 Dollar Value 950,484 546,393 404,091 364,012 40,729 % of Sales 100.00% 55.11% 44.89% 39.05% -0.13% 5.98% 0.00% -0.14% 0.07% 0.00% -0.13% -0.20% 5.78% 2.14% 3.64% % of Sales 100.00% 57.49% 42.51% 38.30% 0.00% 4.29% 0.00% -0.10% 0.15% 0.00% -0.50% -0.45% 3.76% 1.39% 2.37% Net Sales Cost of sales Gross Profit Selling, general and administrative expenses Non-recurring charge (credit) Income from operations Other income (expense): Interest expense Interest income Gain on sale of subsidiary Other Total other income (expense), net Income before income taxes Income tax provision Net income Basic earnings per share Diluted earnings per share Basic weighted average shares outstanding Diluted weighted average shares outstanding (1,229) 573 2019 Actual Dollar Value % of Sales 1,019,890 100.00% 572,153 56.10% 447,737 43.90% 374,180 36.69% 0.00% 73,557 7.21% 0.00% (878) -0.09% 989 0.10% 0.00% (3,514) -0.34% (3,403) -0.33% 70,154 6.88% 26,658 2.61% 43,495 4.26% 1.48 (983) 1,459 Expected* Dollar Value % of Sales 1,043,083 100.00% 620,046 59.44% 423,037 40.56% 393,031 37.68% 0.00% 46,050 4.41% 0.00% (737) -0.07% 1,017 0.10% 0.00% (2,947) -0.28% (3,037) -0.29% 42,688 4.09% 15,794 1.51% 26,894 2.58% 1.38 1.35 19,558 19,930 Difference Dollar Value % of Sales (23,193) 0.00% (47,893) -3.34% 24,700 3.34% (18,851) -0.99% 0 0.00% 27,506 2.80% 0 0.00% (140) -0.02% (28) 0.00% 0 0.00% (567) -0.06% (366) -0.04% 27,466 2.79% 10,864 1.10% 16,602 1.69% 0.10 0.10 (398) (445) (1,091) (1,747) 49,559 18,337 31,222 1.60 1.56 19,555 20,055 (4,798) (4,322) 35,757 13,230 22,527 1.15 1.14 19,531 19,774 1.45 19,159 19,485 luon or obtained by a from 2017 and 10 to dolo for 2010Step by Step Solution
There are 3 Steps involved in it
Step: 1

Get Instant Access to Expert-Tailored Solutions
See step-by-step solutions with expert insights and AI powered tools for academic success
Step: 2

Step: 3

Ace Your Homework with AI
Get the answers you need in no time with our AI-driven, step-by-step assistance
Get Started


