Answered step by step
Verified Expert Solution
Question
1 Approved Answer
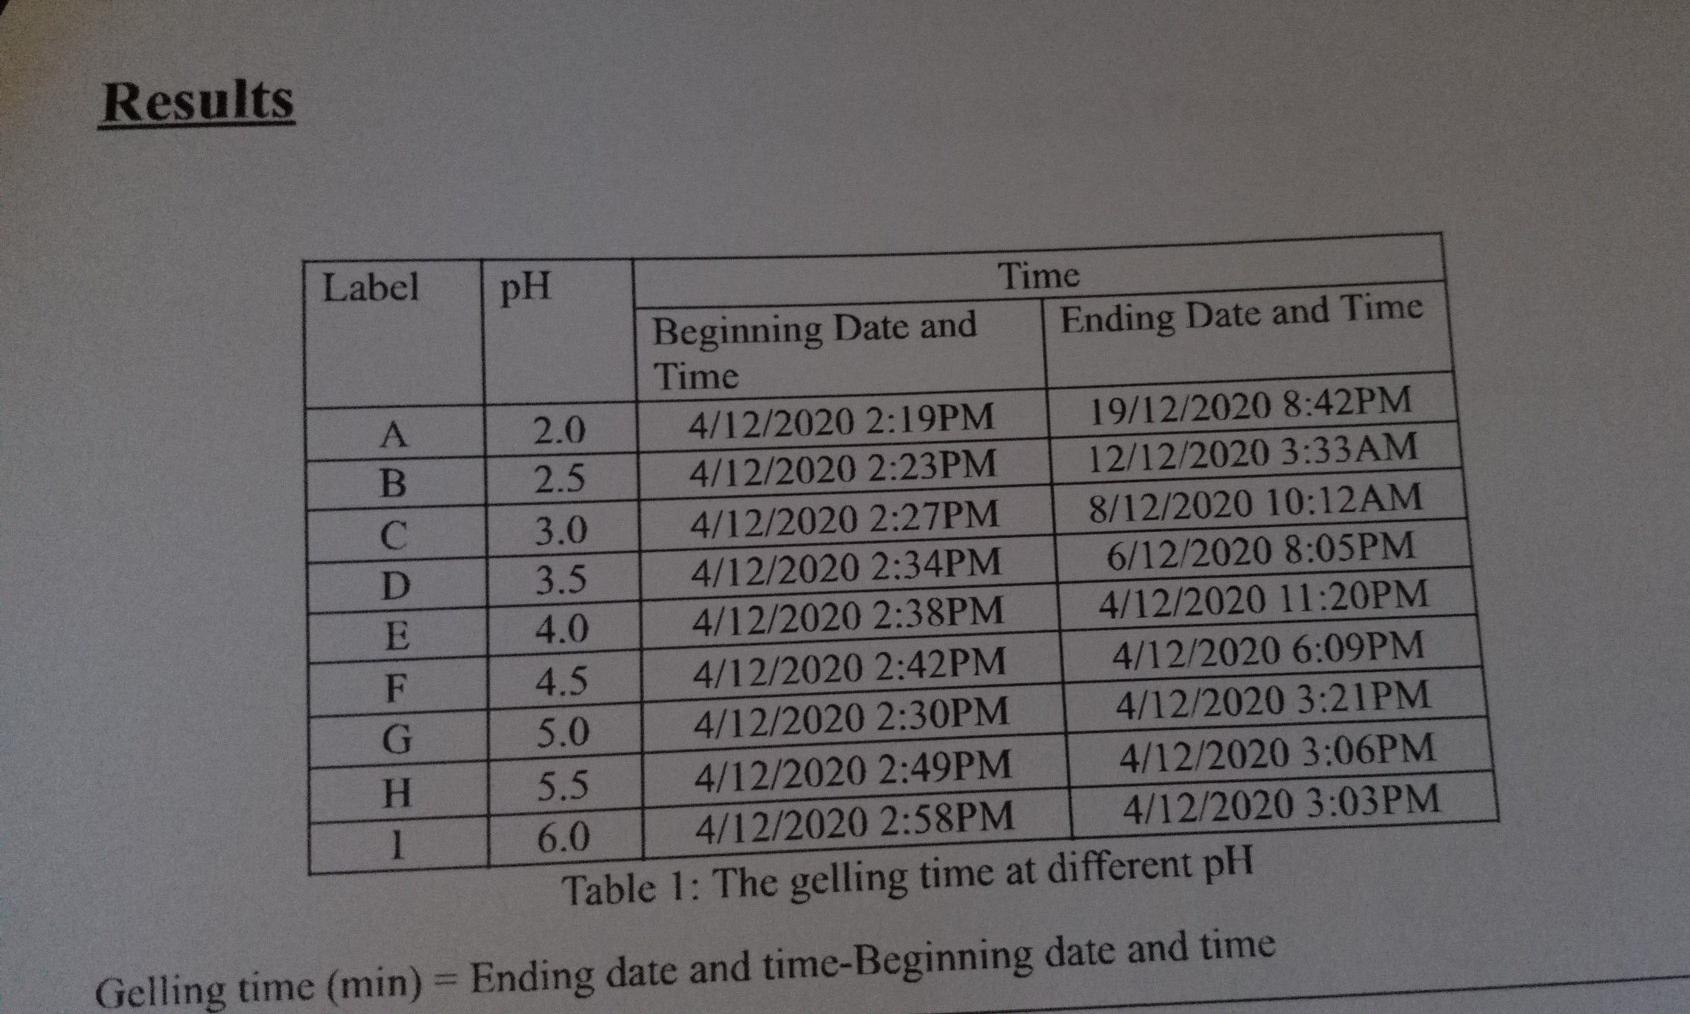
the question is plot the graph of gelling time versus pH (3-6) Results Label pH Time Beginning Date and Ending Date and Time Time A

the question is plot the graph of gelling time versus pH (3-6)
Results Label pH Time Beginning Date and Ending Date and Time Time A B C D E F G H 1 2.0 4/12/2020 2:19PM 19/12/2020 8:42PM 2.5 4/12/2020 2:23PM 12/12/2020 3:33AM 3.0 4/12/2020 2:27PM 8/12/2020 10:12AM 3.5 4/12/2020 2:34PM 6/12/2020 8:05PM 4.0 4/12/2020 2:38PM 4/12/2020 11:20PM 4.5 4/12/2020 2:42PM 4/12/2020 6:09PM 5.0 4/12/2020 2:30PM 4/12/2020 3:21PM 5.5 4/12/2020 2:49PM 4/12/2020 3:06PM 6.0 4/12/2020 2:58PM 4/12/2020 3:03PM Table 1: The gelling time at different pH Gelling time (min) = Ending date and time-Beginning date and timeStep by Step Solution
There are 3 Steps involved in it
Step: 1

Get Instant Access to Expert-Tailored Solutions
See step-by-step solutions with expert insights and AI powered tools for academic success
Step: 2

Step: 3

Ace Your Homework with AI
Get the answers you need in no time with our AI-driven, step-by-step assistance
Get Started


