The question is the screenshot.
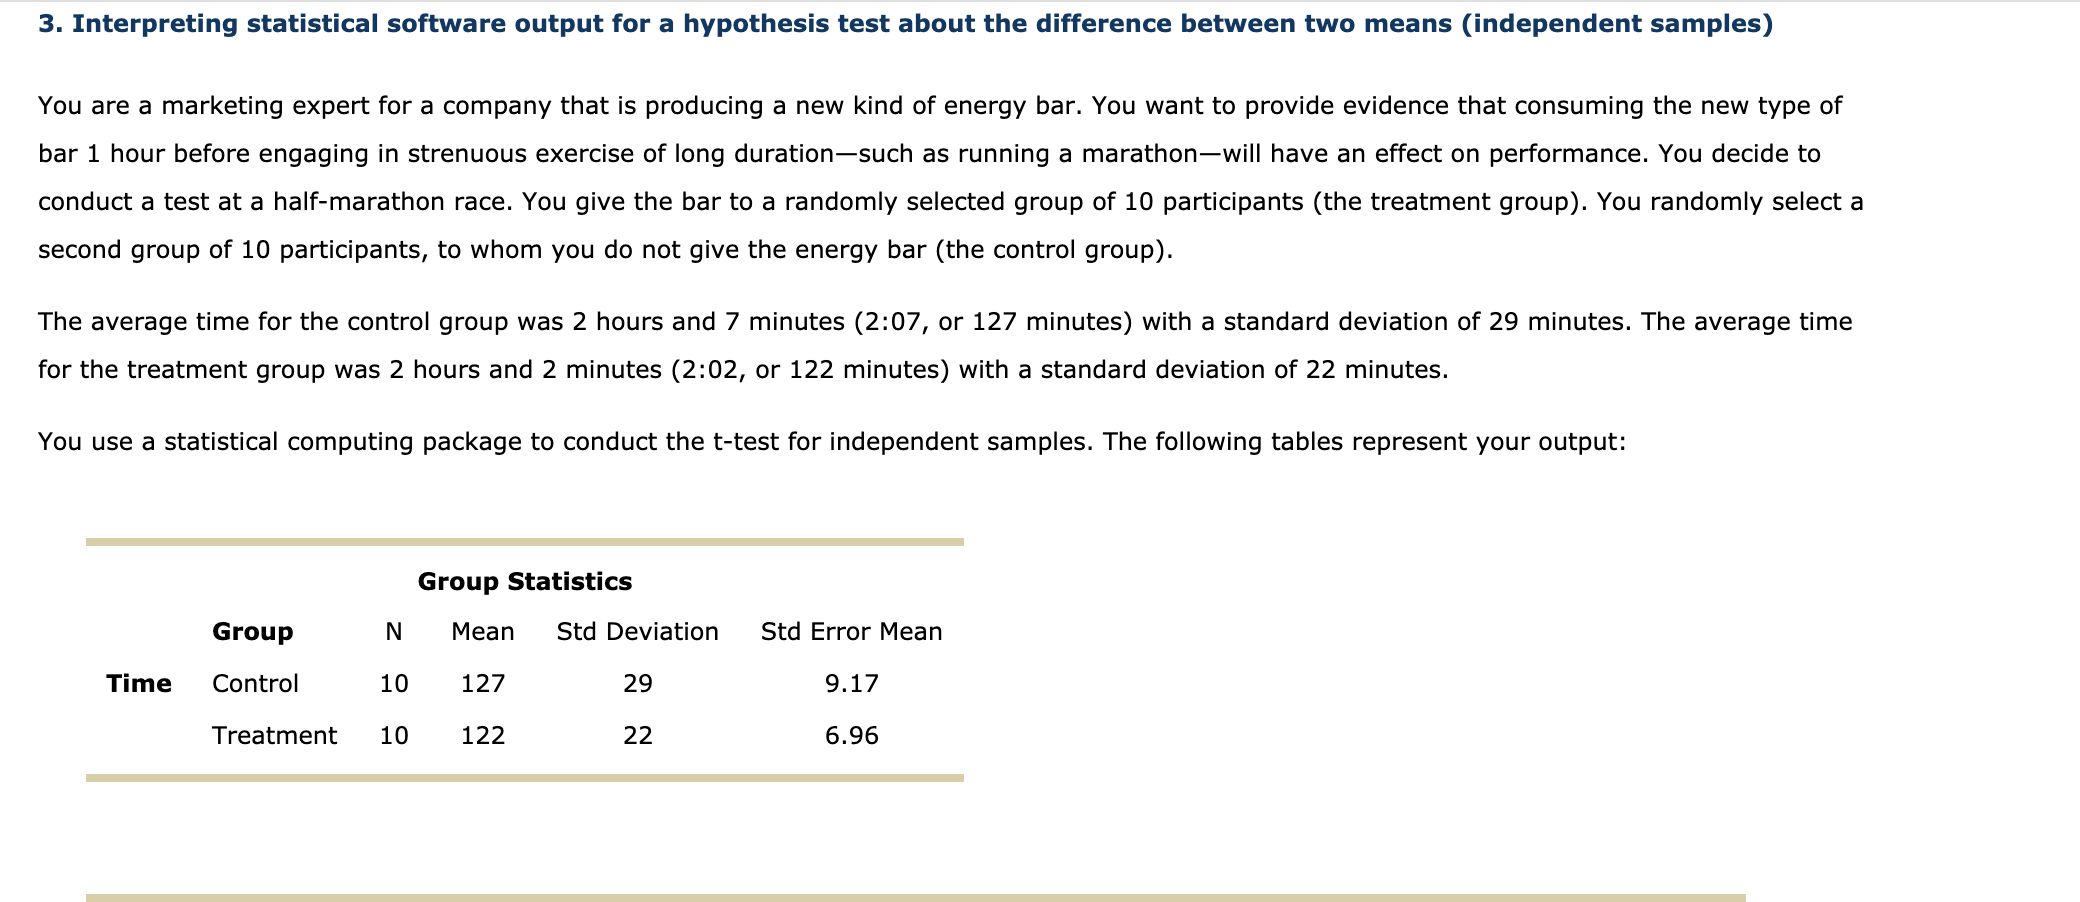
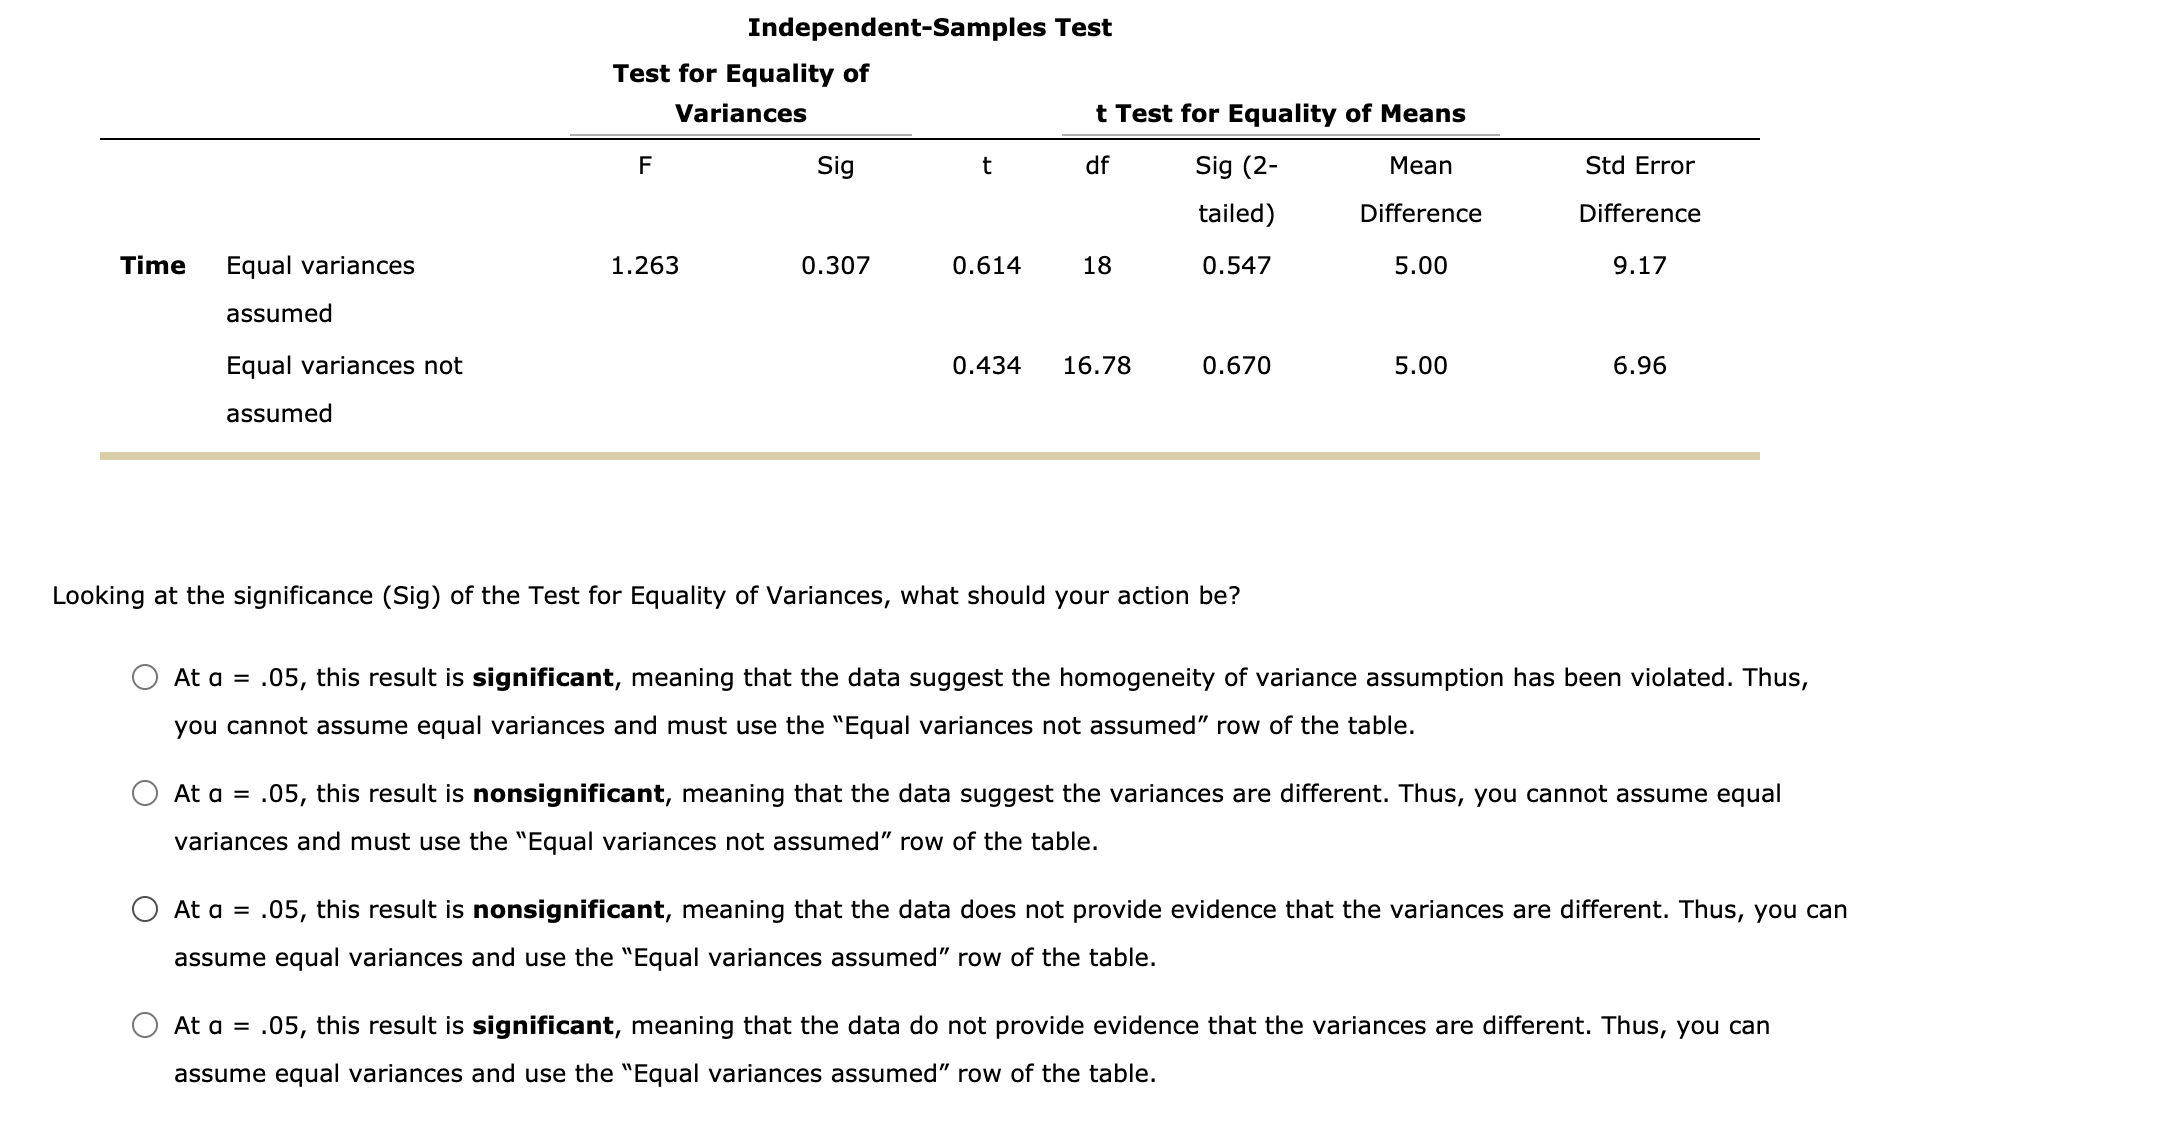
3. Interpreting statistical software output for a hypothesis test about the difference between two means (independent samples) You are a marketing expert for a company that is producing a new kind of energy bar. You want to provide evidence that consuming the new type of bar 1 hour before engaging in strenuous exercise of long durationsuch as running a marathonwill have an effect on performance. You decide to conduct a test at a half-marathon race. You give the bar to a randomly selected group of 10 participants (the treatment group). You randomly select a second group of 10 participants, to whom you do not give the energy bar (the control group). The average time for the control group was 2 hours and 7 minutes (2:07, or 127 minutes) with a standard deviation of 29 minutes. The average time for the treatment group was 2 hours and 2 minutes (2:02, or 122 minutes) with a standard deviation of 22 minutes. You use a statistical computing package to conduct the t-test for independent samples. The following tables represent your output: Group Statistics Group N Mean Std Deviation Std Error Mean Time Control 10 127 29 9.17 Treatment 10 122 22 6.96 Independent-Samples Test Test for Equality of Variances t Test for Equality of Means F Sig t df Sig (2 Mean Std Error tailed) Difference Difference Time Equal variances 1.263 0.307 0.614 18 0.547 5.00 9.17 assumed Equal variances not 0.434 16.78 0.670 5.00 6.96 assumed Looking at the signicance (Sig) of the Test for Equality of Variances, what should your action be? 0 At a = .05, this result is significant, meaning that the data suggest the homogeneity of variance assumption has been violated. Thus, you cannot assume equal variances and must use the \"Equal variances not assumed\" row of the table. 0 At a = .05, this result is nonsignificant, meaning that the data suggest the variances are different. Thus, you cannot assume equal variances and must use the \"Equal variances not assumed\" row of the table. 0 At a = .05, this result is nonsignificant, meaning that the data does not provide evidence that the variances are different. Thus, you can assume equal variances and use the \"Equal variances assumed\" row of the table. 0 At a = .05, this result is significant, meaning that the data do not provide evidence that the variances are different. Thus, you can assume equal variances and use the \"Equal variances assumed\" row of the table. Given these results, which is the most accurate statement you can include in the marketing materials for the energy bar company? (Assume the industry's standard significance level is a = .05.) O Consuming the energy bar 1 hour before the race had a significant effect on performance (t(18) = 0.614, p 0.05). O Consuming the energy bar 1 hour before the race had a significant effect on performance (t(18) = 0.614, p > 0.05). Participants ran an average of five minutes faster when they consumed the energy bar. O There was no evidence that consuming the energy bar 1 hour before the race had an effect on performance (t(18) = 0.614, p


