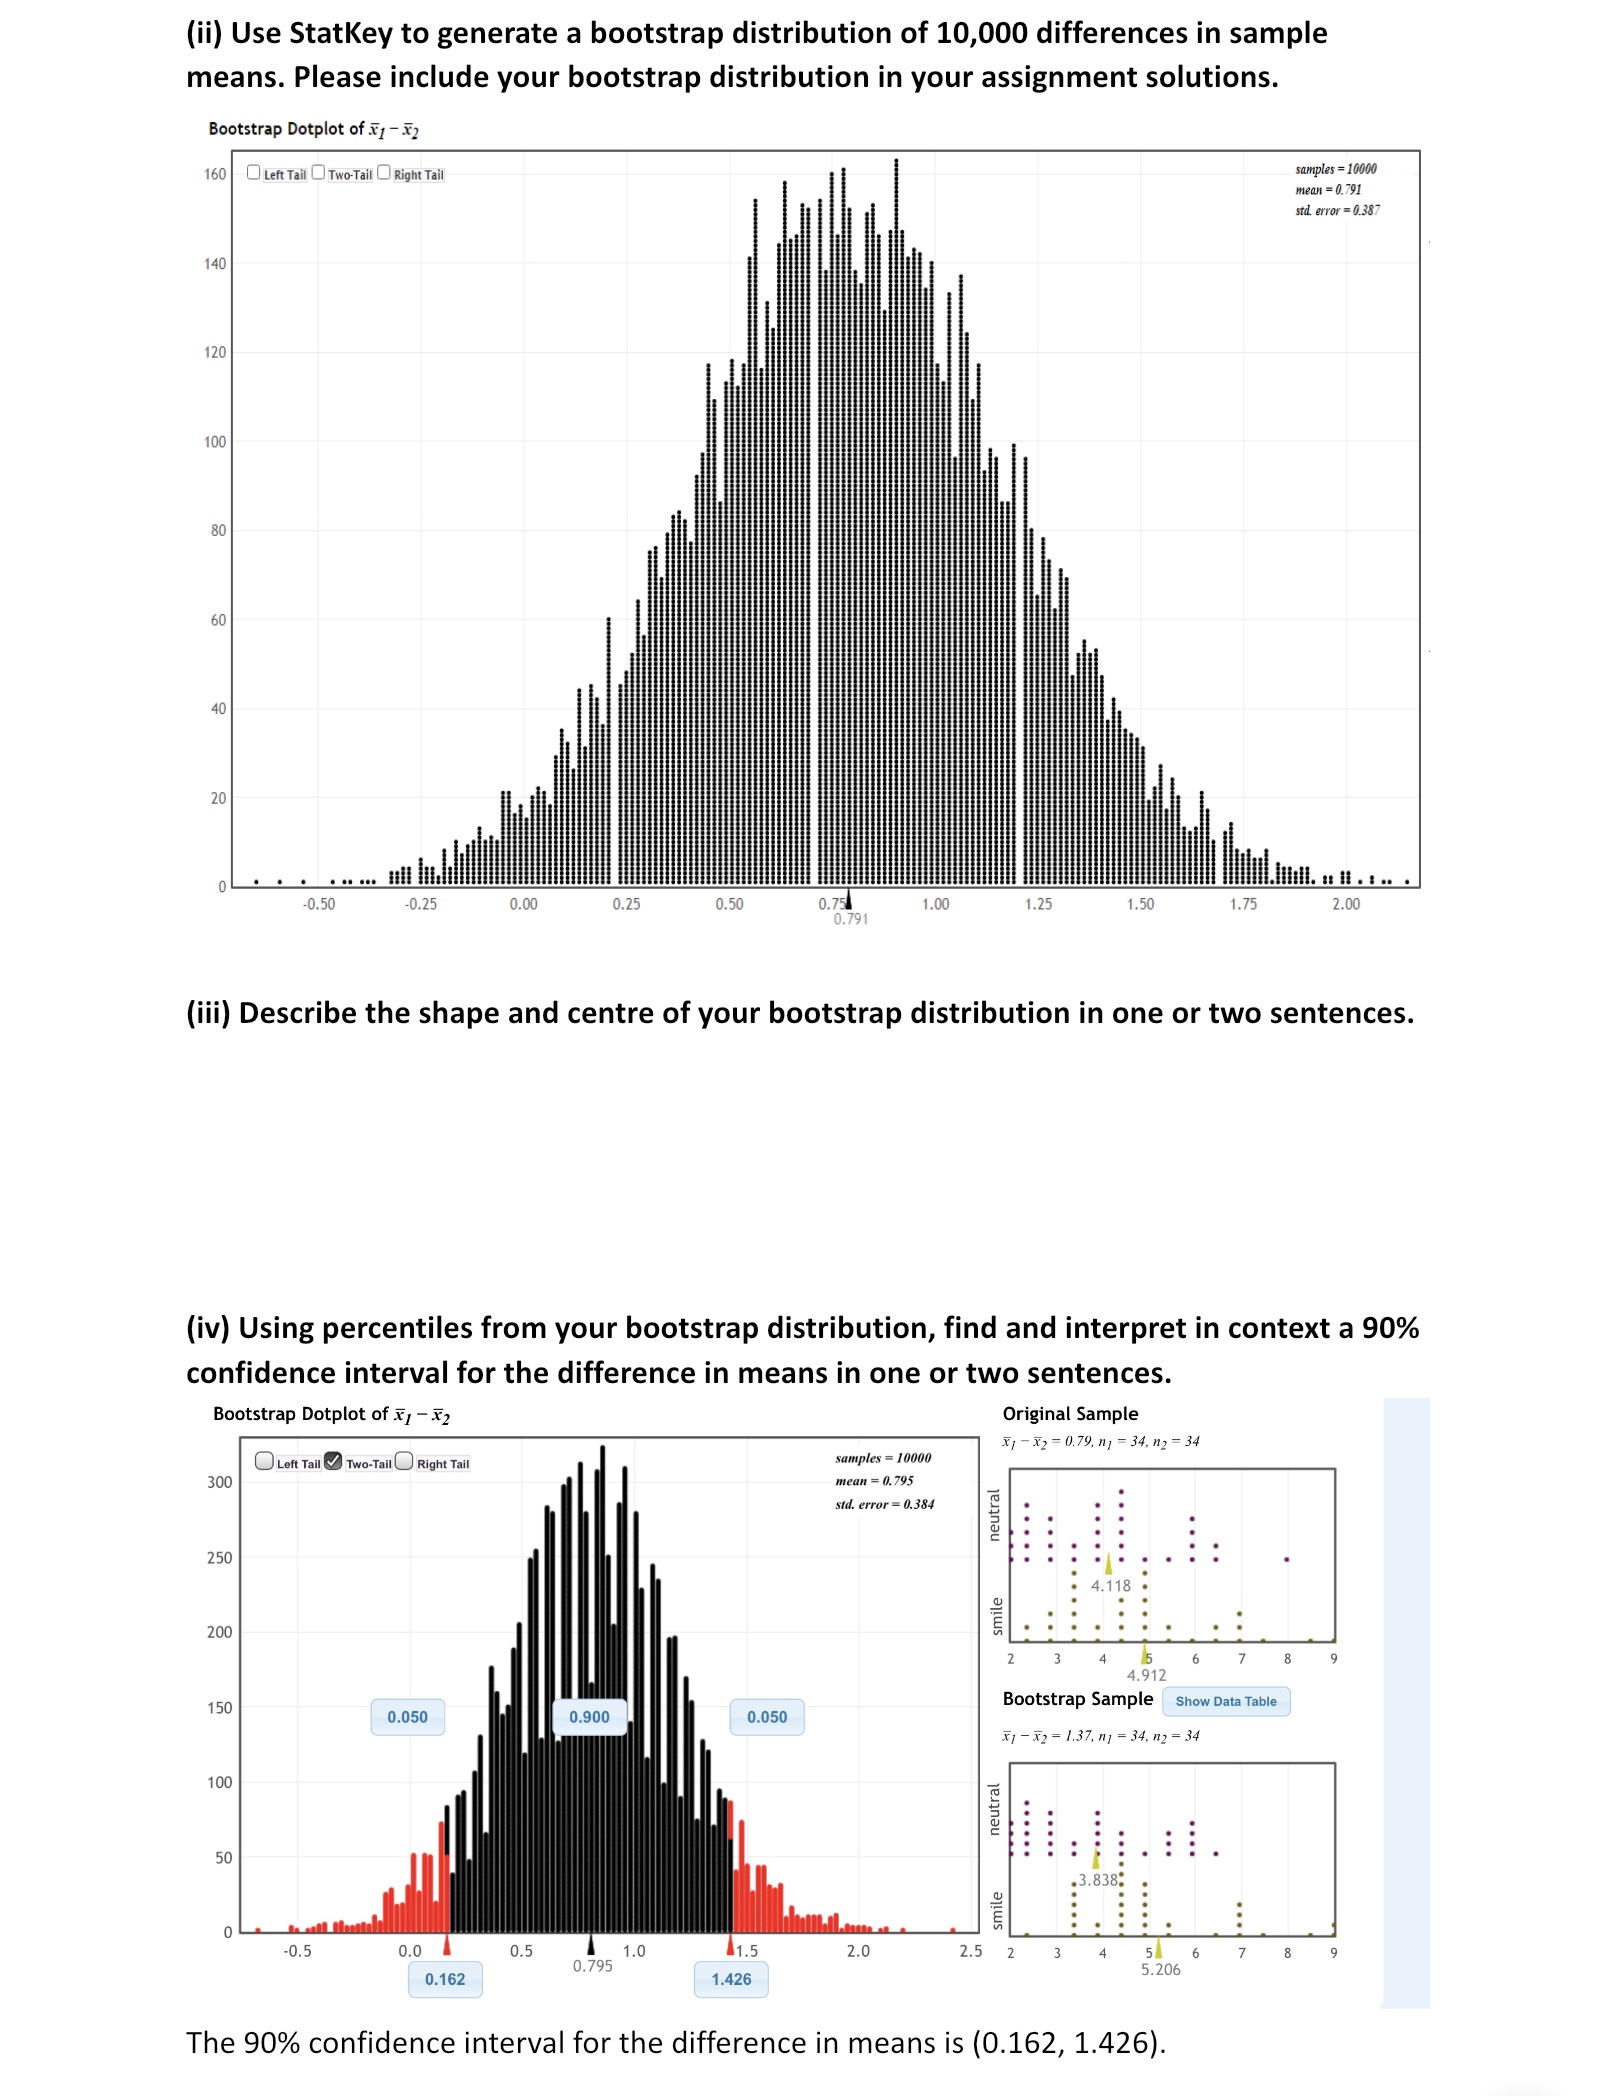
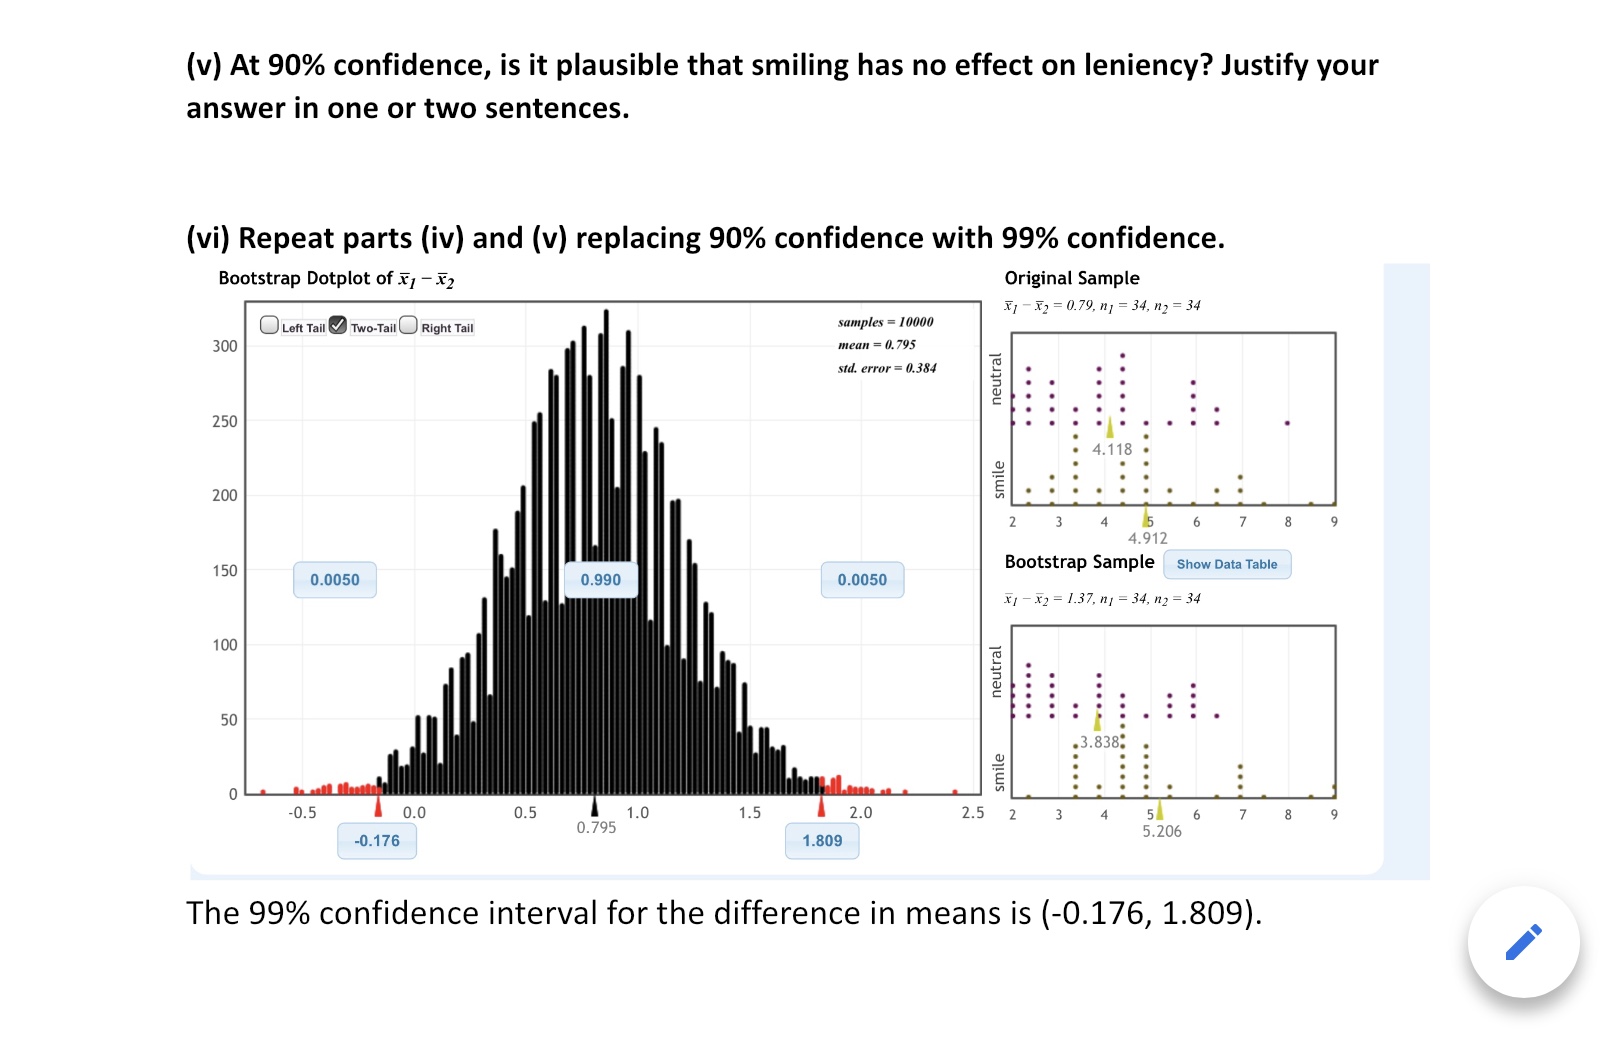
The questions are in the photos below: I would like all of the questions solved apart from question (ii)
(ii) Use Statkey to generate a bootstrap distribution of 10,000 differences in sample means. Please include your bootstrap distribution in your assignment solutions. Bootstrap Dotplot of 1 - 52 160 Left Tail Two-Tail Right Tail samples = 10000 mean = 0.791 stad. error = 0.387 140 120 100 80 60 40 20 . . . .. ... Hit It. -0.50 -0.25 0.00 0.25 0.50 0.75 1.00 1.25 1.50 1.75 2.00 0.791 (iii) Describe the shape and centre of your bootstrap distribution in one or two sentences. (iv) Using percentiles from your bootstrap distribution, find and interpret in context a 90% confidence interval for the difference in means in one or two sentences. Bootstrap Dotplot of X1 -X2 Original Sample *1 - X2 = 0.79, n1 = 34, n2 = 34 Left Tail Two-Tail Right Tail samples = 10000 300 mean = 0.795 sid. error = 0.384 neutral . . . . . . . 250 . . . -118 smile 200 5 4.912 150 Bootstrap Sample Show Data Table 0.050 0.900 0.050 x1 - X2 = 1.37, n1 = 34, n2 = 34 100 neutra . . . : . . . . 50 . .3.838 . . . . . .... smile : . 0.5 0.0 0.5 to5 1.0 1.5 2.0 2.5 2 7 0.795 0.162 1.426 5.206 The 90% confidence interval for the difference in means is (0.162, 1.426).The Smiles dataset contains results from an experiment that studied the effects of smiling and leniency in judging students accused of cheating. The population parameter of interest is a difference in means *s - an, where as and on are the average leniency scores for smiling students and students with neutral expression, respectively. In answering the questions below make sure you use appropriate notation where necessary.(v) At 90% confidence, is it plausible that smiling has no effect on leniency? Justify your answer in one or two sentences. (vi) Repeat parts (iv) and (v) replacing 90% confidence with 99% confidence. Bootstrap Dotplot of *1 - X2 Original Sample X1 - X2 = 0.79, n1 = 34, n2 = 34 OLeft Tail Two-Tail Right Tail samples = 10000 300 mean = 0.795 std. error = 0.384 neutral 250 smile 200 8 4.912 150 Bootstrap Sample Show Data Table 0.0050 0.990 0.0050 X1 - x2 = 1.37, n1 = 34, n2 = 34 100 neutral . ... . . . . . . . . . . 50 Co. . . . . . .......... . .." . . . .. smile . . . -0.5 0.0 0.5 1.0 1.5 2.0 2.5 2 3 7 0.795 51 6 8 -0.176 1.809 5.206 The 99% confidence interval for the difference in means is (-0.176, 1.809)