

Answered step by step
Verified Expert Solution
Question
1 Approved Answer
The rectangles in the graph below illustrate a left endpoint Riemann sum for f(x) = The value of this left endpoint Riemann sum is
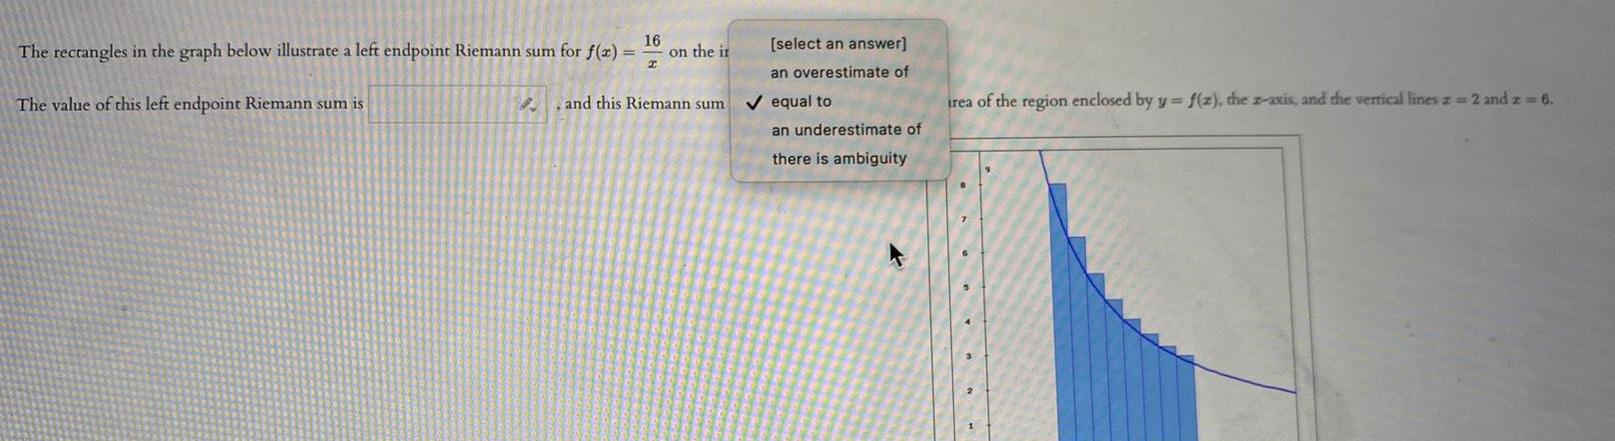
The rectangles in the graph below illustrate a left endpoint Riemann sum for f(x) = The value of this left endpoint Riemann sum is 16 = I on the it and this Riemann sum [select an answer] an overestimate of equal to an underestimate of there is ambiguity irea of the region enclosed by y= f(z), the z-axis, and the vertical lines z = 2 and z = 6.
Step by Step Solution
There are 3 Steps involved in it
Step: 1

Get Instant Access to Expert-Tailored Solutions
See step-by-step solutions with expert insights and AI powered tools for academic success
Step: 2

Step: 3
Ace Your Homework with AI
Get the answers you need in no time with our AI-driven, step-by-step assistance
Get Started
Advanced Engineering Mathematics
Authors: Erwin Kreyszig
5th Edition
471862517, 978-0471862512