

Question
The regression output below is incomplete. The data is gasoline per licensed driver as a function of the real gasoline price per gallon from 1949
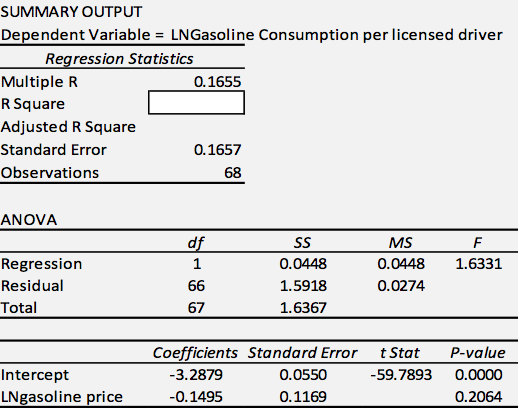
The regression output below is incomplete. The data is gasoline per licensed driver as a function of the real gasoline price per gallon from 1949 to 2016.
The functional format is set up as a nonlinear model by taking the natural logarithm of both annual gasoline per licensed driver and annual real gasoline price per gallon from 1949 to 2016 for the United States.
Log Gasoline per driver = Log 0
- Log 1
Real Price
Step by Step Solution
There are 3 Steps involved in it
Step: 1

Get Instant Access to Expert-Tailored Solutions
See step-by-step solutions with expert insights and AI powered tools for academic success
Step: 2

Step: 3
Ace Your Homework with AI
Get the answers you need in no time with our AI-driven, step-by-step assistance
Get Started
Probability and Random Processes With Applications to Signal Processing and Communications
Authors: Scott Miller, Donald Childers
2nd edition
123869811, 978-0121726515, 121726517, 978-0130200716, 978-0123869814