Answered step by step
Verified Expert Solution
Question
1 Approved Answer
The Requests Your LetsMeet inbox is filling up quickly with requests for data and insights! Cin Tables Views Stored Procedures You currently have three requests
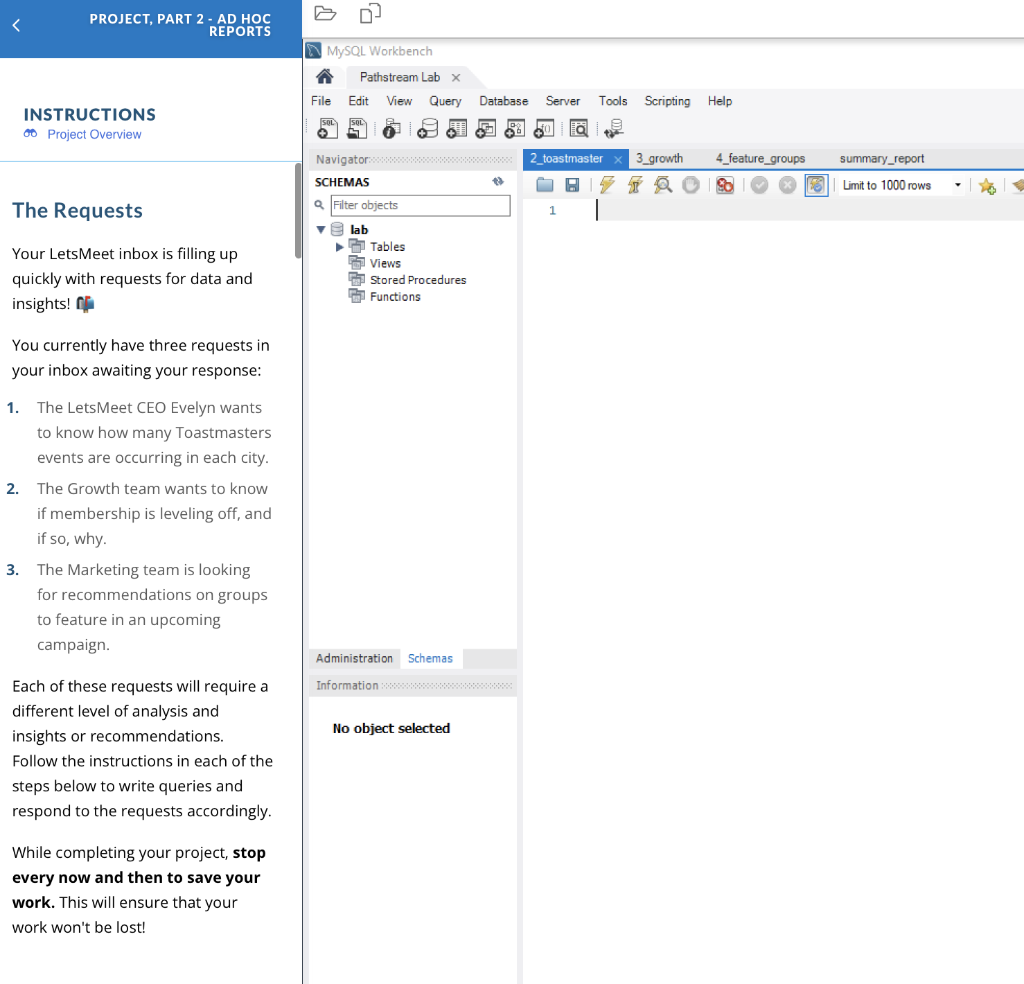
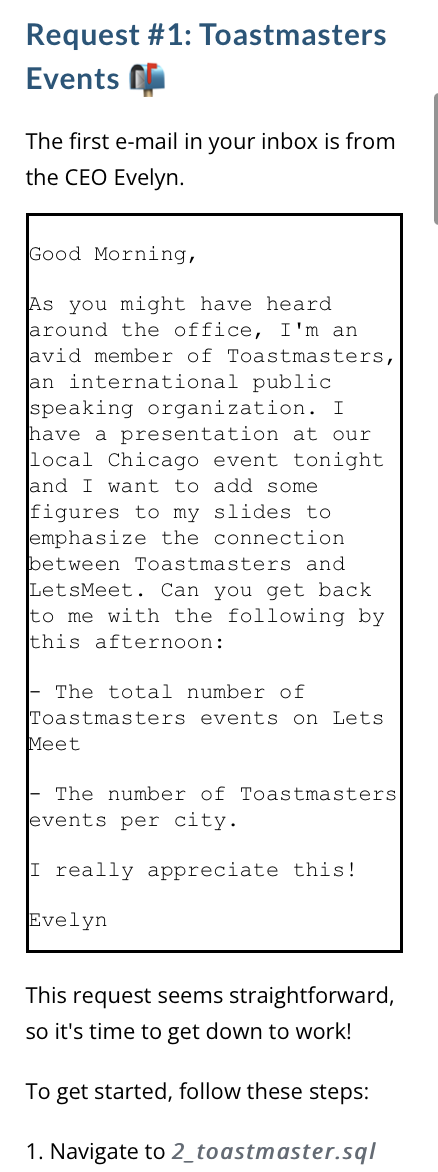

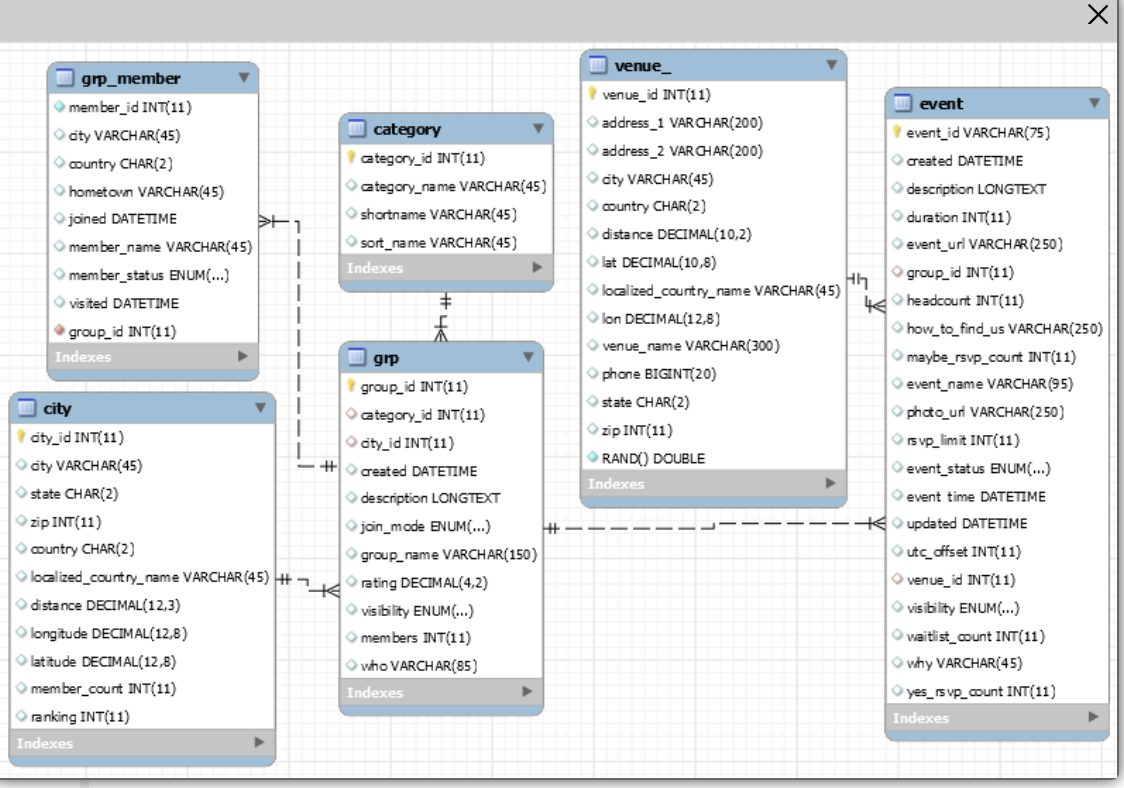
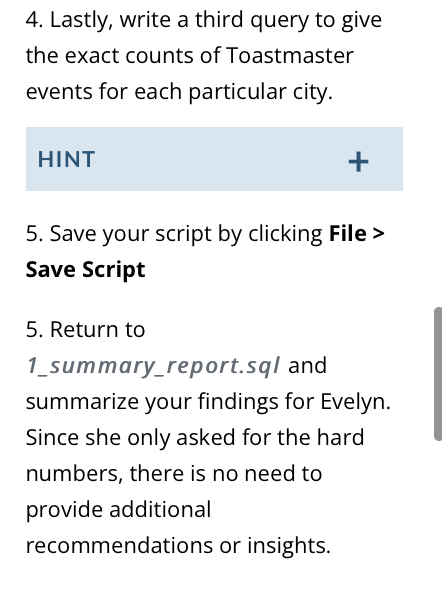
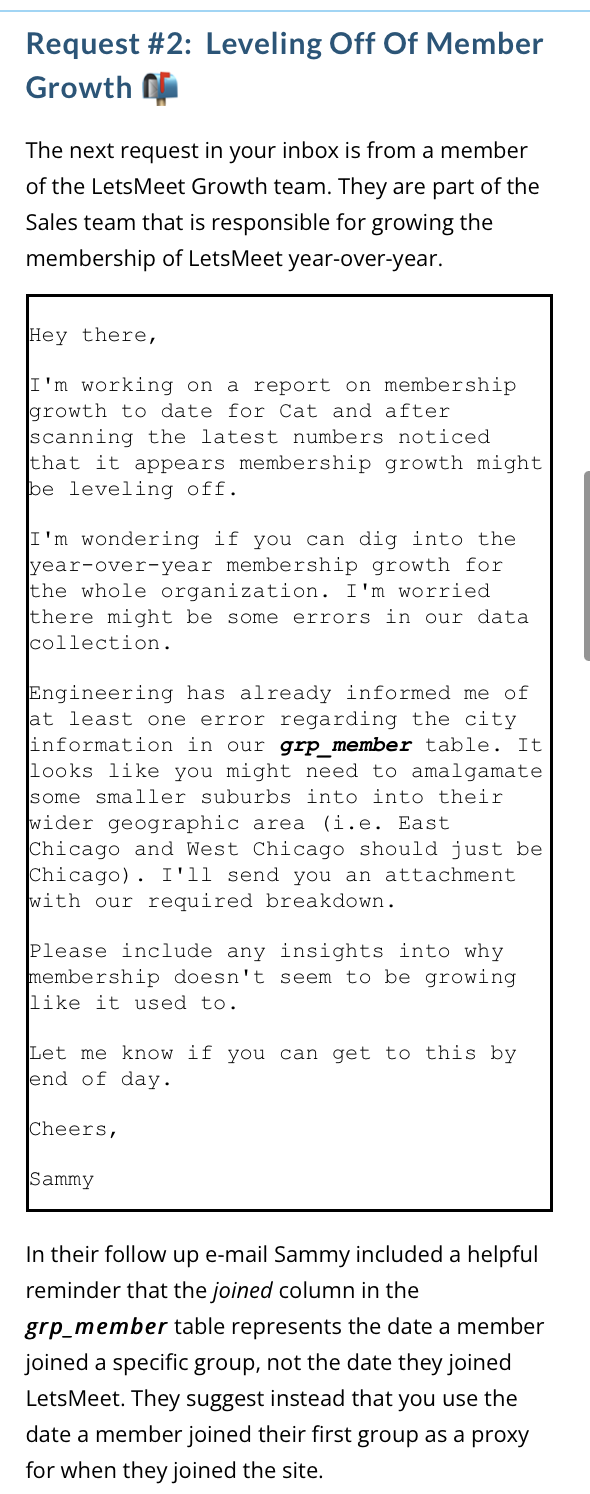
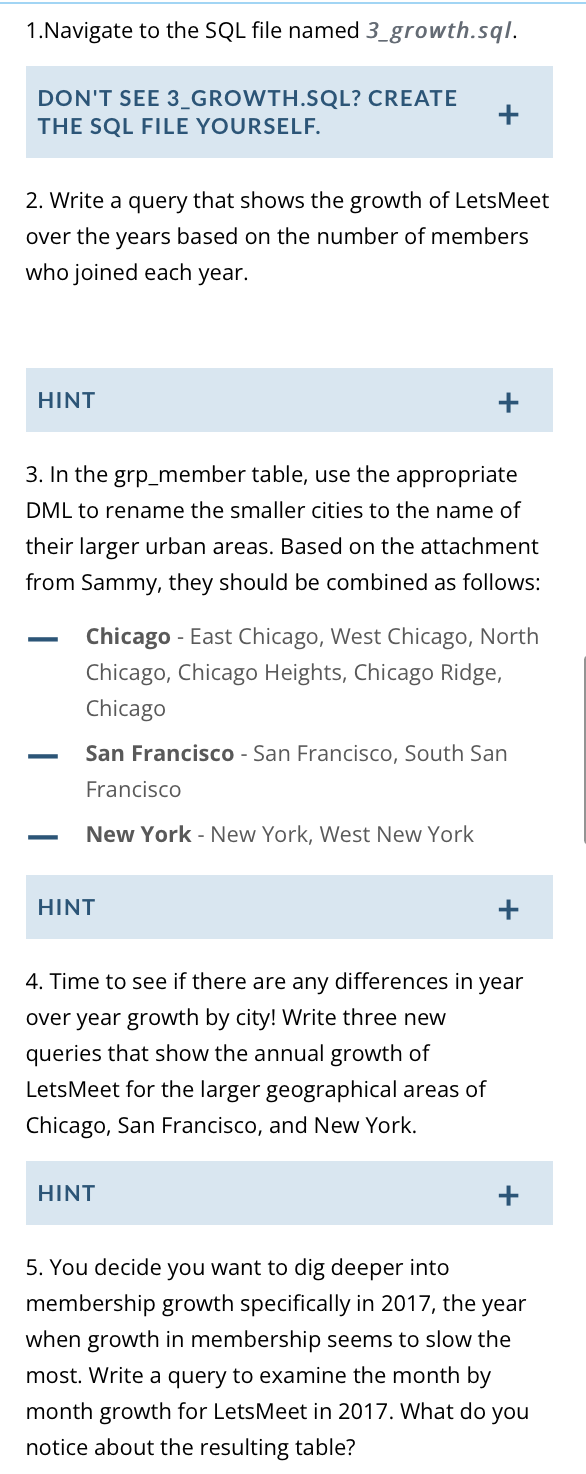
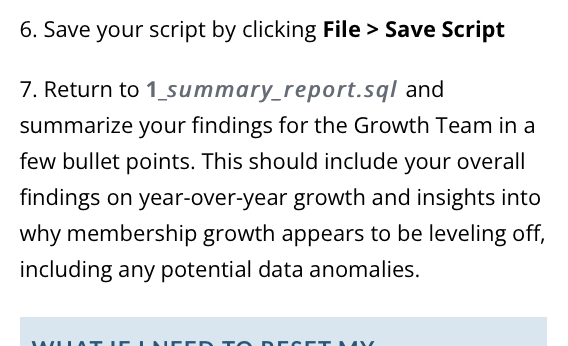
The Requests Your LetsMeet inbox is filling up quickly with requests for data and insights! Cin Tables Views Stored Procedures You currently have three requests in your inbox awaiting your response: 1. The LetsMeet CEO Evelyn wants to know how many Toastmasters events are occurring in each city. 2. The Growth team wants to know if membership is leveling off, and if so, why. 3. The Marketing team is looking for recommendations on groups to feature in an upcoming campaign. Each of these requests will require a different level of analysis and insights or recommendations. No object selected Follow the instructions in each of the steps below to write queries and respond to the requests accordingly. While completing your project, stop every now and then to save your work. This will ensure that your work won't be lost! The first e-mail in your inbox is from This request seems straightforward, so it's time to get down to work! To get started, follow these steps: 1. Navigate to 2_to astmaster.sqI 2. To begin with, you should find all the events that include the word, Toastmaster. You can use string manipulation to return all event names that include "Toastmaster" or "toastmaster." 3. Now that you have the Toastmasters events, write a second query to display them alongside the cities in which they are hosted. HINT You will need to use JOINs to display the events alongside their cities. The ERD below should help with the joins. Find the keys in common between the grp, city, and event tables. 4. Lastly, write a third query to give the exact counts of Toastmaster events for each particular city. 4. Lastly, write a third query to give the exact counts of Toastmaster events for each particular city. 5. Save your script by clicking File > Save Script 5. Return to 1_summary_report.sq/ and summarize your findings for Evelyn. Since she only asked for the hard numbers, there is no need to provide additional recommendations or insights. Request \#2: Leveling Off Of Member Growth Cn The next request in your inbox is from a member of the LetsMeet Growth team. They are part of the Sales team that is responsible for growing the membership of LetsMeet year-over-year. Hey there, I'm working on a report on membership growth to date for Cat and after scanning the latest numbers noticed that it appears membership growth might be leveling off. I'm wondering if you can dig into the year-over-year membership growth for the whole organization. I'm worried there might be some errors in our data collection. Engineering has already informed me of at least one error regarding the city information in our grp member table. It looks like you might need to amalgamate some smaller suburbs into into their wider geographic area (i.e. East chicago and West Chicago should just be chicago). I'll send you an attachment with our required breakdown. Please include any insights into why membership doesn't seem to be growing like it used to. Let me know if you can get to this by end of day. cheers, Sammy later In their follow up e-mail Sammy included a helpful reminder that the joined column in the grp_member table represents the date a member joined a specific group, not the date they joined LetsMeet. They suggest instead that you use the date a member joined their first group as a proxy for when they joined the site. 1.Navigate to the SQL file named 3_growth.sqI. 2. Write a query that shows the growth of LetsMeet over the years based on the number of members who joined each year. 3. In the grp_member table, use the appropriate DML to rename the smaller cities to the name of their larger urban areas. Based on the attachment from Sammy, they should be combined as follows: - Chicago - East Chicago, West Chicago, North Chicago, Chicago Heights, Chicago Ridge, Chicago - San Francisco - San Francisco, South San Francisco - New York - New York, West New York HINT 4. Time to see if there are any differences in year over year growth by city! Write three new queries that show the annual growth of LetsMeet for the larger geographical areas of Chicago, San Francisco, and New York. 5. You decide you want to dig deeper into membership growth specifically in 2017, the year when growth in membership seems to slow the most. Write a query to examine the month by month growth for LetsMeet in 2017. What do you notice about the resulting table? 6. Save your script by clicking File > Save Script 7. Return to 1_summary_report.sq/ and summarize your findings for the Growth Team in a few bullet points. This should include your overall findings on year-over-year growth and insights into why membership growth appears to be leveling off, including any potential data anomalies
Step by Step Solution
There are 3 Steps involved in it
Step: 1

Get Instant Access to Expert-Tailored Solutions
See step-by-step solutions with expert insights and AI powered tools for academic success
Step: 2

Step: 3

Ace Your Homework with AI
Get the answers you need in no time with our AI-driven, step-by-step assistance
Get Started


