Answered step by step
Verified Expert Solution
Link Copied!

Question

1 Approved Answer

The researcher was interested in how athletes felt about their athletic experiences. She created a four question survey with a five-point Likert scale asking about

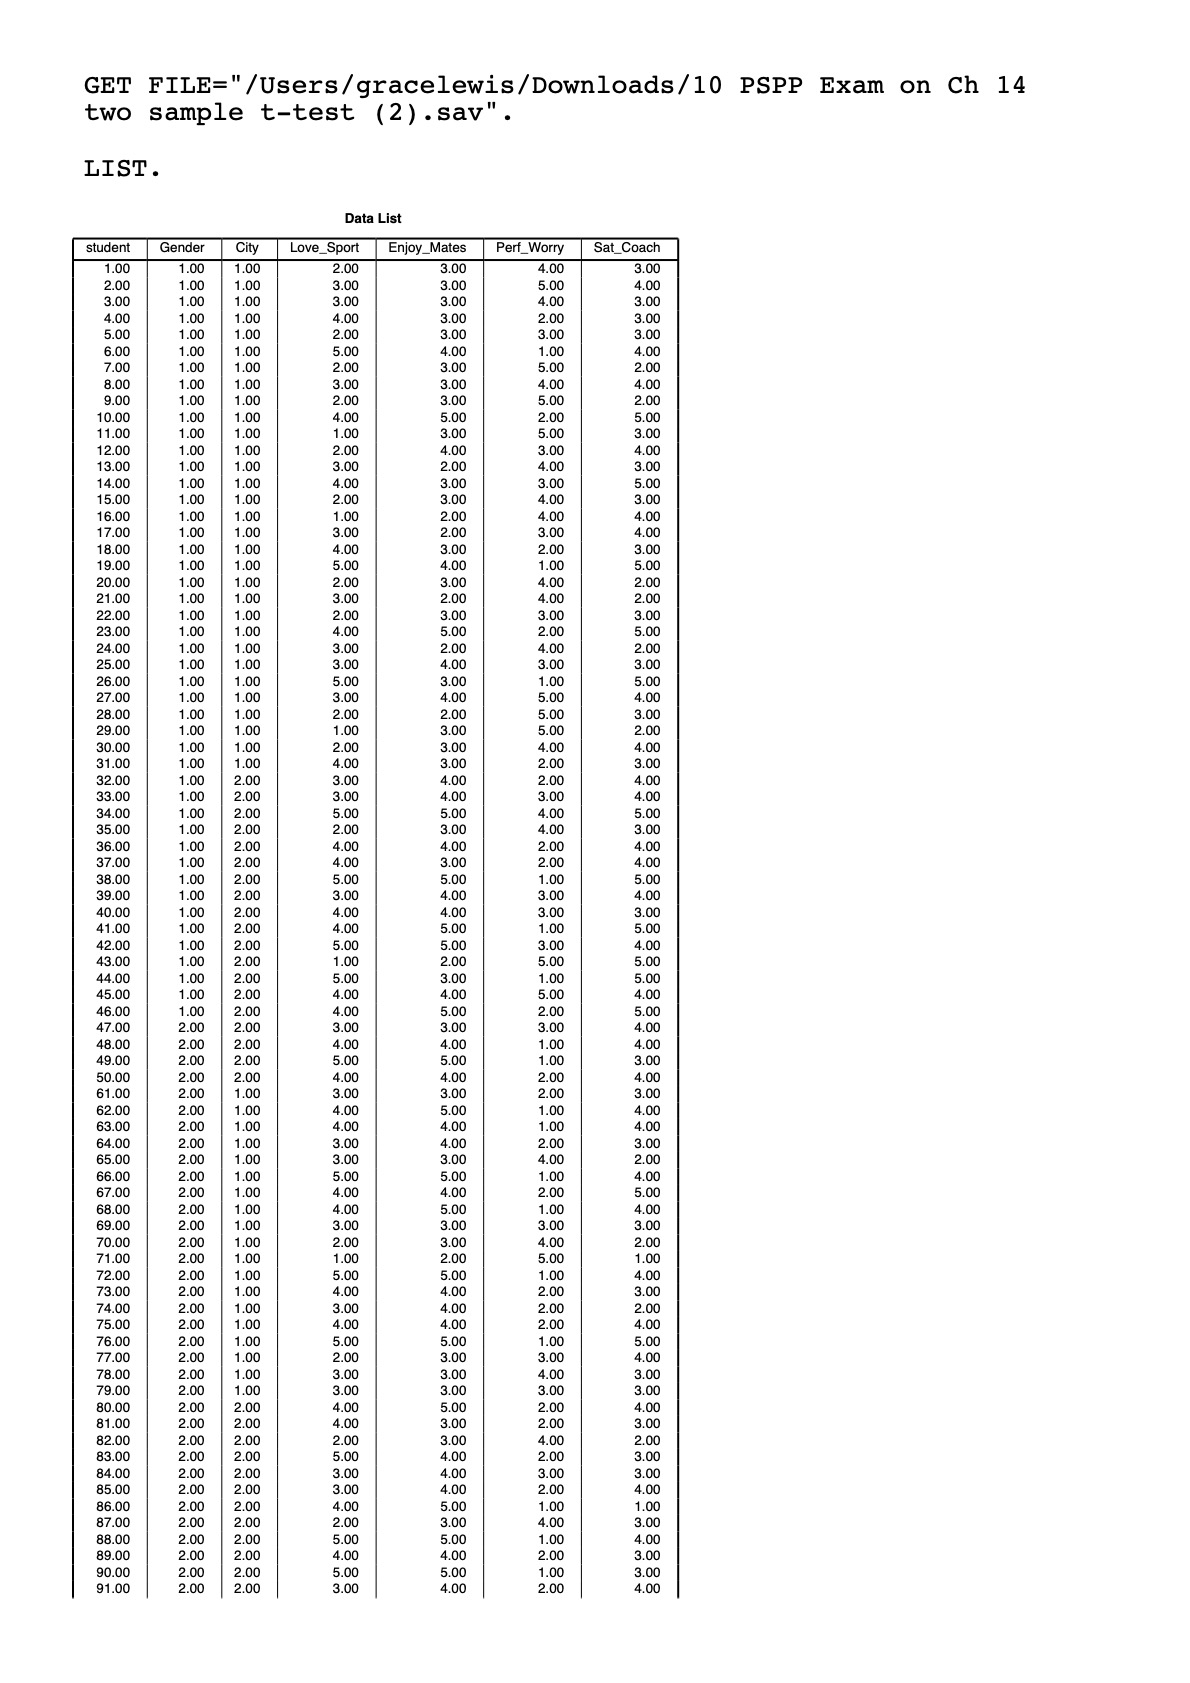
The researcher was interested in how athletes felt about their athletic experiences. She created a four question survey with a five-point Likert scale asking about (1) how much they love their sport, (2) how much they enjoy their teammates, (3) how much they worry about their athletic performance, and (4) how satisfied they are with their coach. She then randomly sampled 85 male and female high school athletes from the San Diego and the Dallas school districts who started for their high school teams.

1. Do the male athletes differ from the female athletes in how much they love their sport?

  1. What are the null and alternative hypotheses?
  2. Is the Levene Test significant? What does this mean?
  3. Is the difference between the men and women in how much they love their sport statistically significant?
  4. What can we conclude? Explain with a narrative.
2. Do the male athletes differ from the female athletes in how much they enjoy their teammates?

  1. What are the null and alternative hypotheses?
  2. Is the Levene Test significant? What does this mean?
  3. Is the difference between the men and women in how much they enjoy their teammates statistically significant?
  4. What can we conclude? Explain with a narrative.

3. Do the male athletes differ from the female athletes in how much they worry about their athletic performance?

  1. What are the null and alternative hypotheses?
  2. Is the Levene Test significant? What does this mean?
  3. Is the difference between the men and women in how much they worry about their athletic performance statistically significant?
  4. What can we conclude? Explain with a narrative.

4. Do the male athletes differ from the female athletes in how much they are satisfied with their coach?

  1. What are the null and alternative hypotheses?
  2. Is the Levene Test significant? What does this mean?
  3. Is the difference between the men and women in how much they are satisfied with their coach statistically significant?
  4. What can we conclude? Explain with a narrative.
image text in transcribed
GET FILE=" /Users/gracelewis/Downloads/10 PSPP Exam on Ch 14 two sample t-test (2) . sav". LIST. Data List student Gender City Love_Sport Enjoy_Mates Perf_Worry Sat_Coach 1.00 1.00 1.00 2.0 3.00 4.00 3.00 2.00 1.00 1.00 3.0 3.00 5.00 4.00 3.00 1.00 1.00 3.00 3.00 4.0 3.00 4.00 1.00 1.00 4.00 3.00 2.00 3.00 5.00 1.00 1.00 2.00 3.00 3.00 3.00 6.00 1.00 1.0 5.00 4.00 1.00 4.00 7.00 1.00 1.00 2.00 3.00 5.00 2.0 3.00 1.00 1.00 3.00 3.00 4.00 4.00 9.00 1.00 1.00 2.0 3.00 5.00 2.0 10.00 1.00 1.00 4.00 5.00 2.00 5.00 11.00 1.00 1.00 1.00 3.00 5.00 3.00 2.00 1.00 1.00 2.00 4.00 3.00 4.00 13.00 1.00 1.0 3.00 2.00 4.00 3.00 14.00 1.00 1.00 4.00 3.00 3.00 5.00 15.00 1.00 1.00 2.00 3.00 4.00 3.00 16.00 1.00 1.00 1.0 2.00 4.00 4.00 17.00 1.00 1.00 3.00 2.00 3.00 4.00 18.00 1.00 1.00 4.00 3.00 2.00 3.00 9.00 1.00 1.00 5.0 4.00 1.00 5.0 20.00 1.00 1.00 2.00 3.00 4.00 2.00 21.00 1.00 1.00 3.00 2.00 4.00 2.00 22.00 1.00 1.00 2.0 3.00 3.00 3.00 23.00 1.00 1.00 4.0 5.00 2.00 5.00 4.00 1.00 1.00 3.00 2.00 4.00 2.00 25.00 1.00 1.00 3.00 4.00 3.00 3.00 6.00 1.00 1.00 5.00 3.00 1.00 5.0 27.00 1.00 1.00 3.00 4.00 5.00 4.00 28.00 1.00 1.00 2.00 2.00 5.00 3.00 29.00 1.00 1.00 1.00 3.00 5.00 2.00 30.00 1.00 1.00 2.00 3.00 4.00 4.00 31.00 1.00 1.00 4.00 3.00 2.00 3.00 32.00 1.00 2.00 3.00 4.00 2.00 4.00 33,00 1.00 2.00 3.00 4.00 3.00 4.00 34.00 1.OO 2.00 5.00 5.00 4.00 5.00 35.00 1.00 2.00 2.00 3.00 4.00 3.00 16.00 1.00 2.00 4.0 4.00 2.00 4.0 37.00 1.00 2.0 4.00 3.00 2.00 4.00 8.00 1.00 2.00 5.00 5.00 1.00 5.00 39.00 1.00 2.00 3.0 4.00 3.00 4.00 40.00 2.00 4.00 4.00 3.00 3.00 41.00 1.00 2.00 4.00 5.00 1.00 5.0 42.00 1.00 2.00 5.00 5.00 3.00 4.00 3.00 100 2.00 1.0 2.00 5.00 5.0 44.00 1.00 2.00 5.00 3.00 1.00 5.00 45.00 1.00 2.00 4.00 4.00 5.00 4.00 6.00 1.00 2.00 4.0 5.00 2.00 5.00 47.0 2.00 2.00 3.00 3.00 3.00 4.00 48.00 2.00 2.00 4.0 4.00 1.00 4.00 49.00 2.00 2.00 5.00 5.00 1.00 3.00 50.00 2.00 2.0 4.0 4.00 2.00 4.00 61.00 2.00 1.00 3.00 3.00 2.00 3.00 62.00 2.00 1.00 4.00 5.00 1.00 4.00 :3.00 2.00 1.00 4.0 4.00 1.00 4.0 64.00 2.00 1.00 3.00 4.00 2.00 3.00 65.00 2.00 3.00 3.00 4.00 2.00 66.00 2.00 1.00 5.00 5.00 1.00 4.00 67.00 2.00 1.00 4.00 4.00 2.00 5.00 68.0 2.00 1.00 4.00 5.00 1.00 4.00 69.00 2.00 1.00 3.00 3.00 3.00 3.00 70.00 2.00 1.00 2.00 3.00 4.00 2.00 71.00 2.00 1.00 1.00 2.00 5.00 1.00 72.00 2.00 1.00 5.00 5.00 1.00 4.00 73.00 2.00 1.00 4.00 4.00 2.00 3.00 74.00 2.00 1.00 3.00 4.00 2.00 2.00 75.00 2.00 1.00 4.00 4.00 2.00 4.00 76.00 2.00 1.00 5.00 5.00 1.00 5.00 2.00 2.00 3.00 3.00 4.00 78.00 2.00 1.00 3.00 3.00 4.00 3.00 79.00 2.00 1.00 3.00 3.00 3.00 3.00 :0.00 2.00 2.00 4.0 5.00 2.00 4.0 81.00 2.00 2.00 4.00 3.00 2.00 3.00 82.0 2.00 2.00 2.00 3.00 4.00 2.00 83.00 2.00 2.00 5.00 4.00 2.00 3.00 84.00 2.00 2.00 3.00 4.00 3.00 3.00 85.00 2.00 2.00 3.00 4.00 2.00 4.0 86.00 2.00 2.00 4.00 5.00 1.00 1.00 7.00 2.00 2.00 2.0 3.00 4.00 3.0 38.0 2.00 2.00 5.00 5.00 1.00 4.00 89.00 2.00 2.00 4.00 4.00 2.00 3.00 90.00 2.00 2.00 5.00 5.00 1.00 3.00 91.00 2.00 2.00 3.00 4.00 2.00 4.00

Step by Step Solution

There are 3 Steps involved in it

Step: 1

blur-text-image

Get Instant Access to Expert-Tailored Solutions

See step-by-step solutions with expert insights and AI powered tools for academic success

Step: 2

blur-text-image

Step: 3

blur-text-image

Ace Your Homework with AI

Get the answers you need in no time with our AI-driven, step-by-step assistance

Get Started

Recommended Textbook for

More Books

Students also viewed these Mathematics questions