Answered step by step
Verified Expert Solution
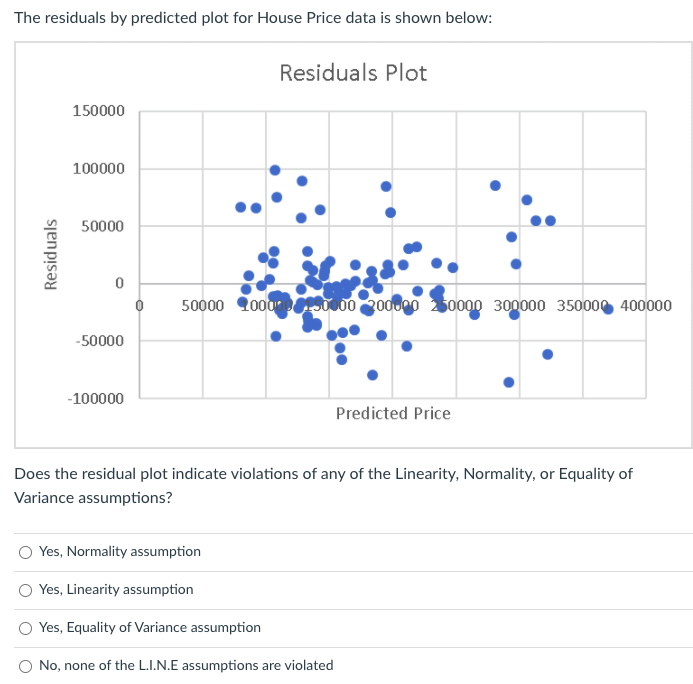
Link Copied!

Question

1 Approved Answer

The residuals by predicted plot for House Price data is shown below: Residuals Plot 150000 100000 50000 Residuals 0 50000 20000 8000 200600 250000 300000

image text in transcribed
The residuals by predicted plot for House Price data is shown below: Residuals Plot 150000 100000 50000 Residuals 0 50000 20000 8000 200600 250000 300000 350000 400000 -50000 -100000 Predicted Price Does the residual plot indicate violations of any of the Linearity, Normality, or Equality of Variance assumptions? O Yes, Normality assumption O Yes, Linearity assumption O Yes, Equality of Variance assumption O No, none of the L.I.N.E assumptions are violated

Step by Step Solution

There are 3 Steps involved in it

Step: 1

blur-text-image

Get Instant Access to Expert-Tailored Solutions

See step-by-step solutions with expert insights and AI powered tools for academic success

Step: 2

blur-text-image

Step: 3

blur-text-image

Ace Your Homework with AI

Get the answers you need in no time with our AI-driven, step-by-step assistance

Get Started

Recommended Textbook for

Beginning Algebra A Text/Workbook

Authors: Charles P McKeague

2nd Edition

1483271242, 9781483271248

More Books

Students also viewed these Mathematics questions

Question

Describe regulatory focus theory.

Answered: 1 week ago