The returns on a Treasury bill (i.e. a risk-free asset) and on equity (i.e. a risky asset) are given below (for four states of

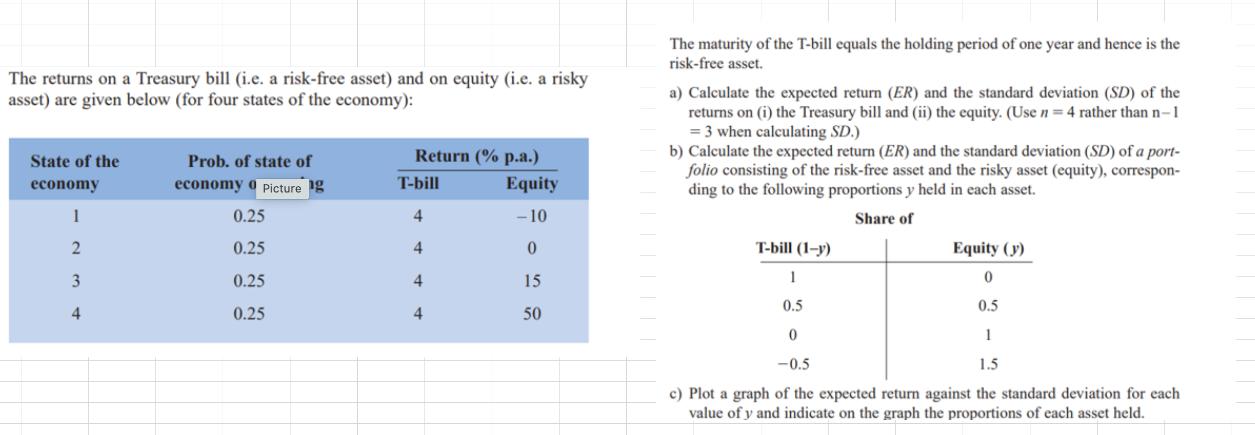
The returns on a Treasury bill (i.e. a risk-free asset) and on equity (i.e. a risky asset) are given below (for four states of the economy): State of the economy 1 2 3 4 Prob. of state of economy 0 Picture g 0.25 0.25 0.25 0.25 Return (% p.a.) T-bill 4 4 4 4 Equity -10 0 15 50 The maturity of the T-bill equals the holding period of one year and hence is the risk-free asset. a) Calculate the expected return (ER) and the standard deviation (SD) of the returns on (i) the Treasury bill and (ii) the equity. (Use n = 4 rather than n-1 = 3 when calculating SD.) b) Calculate the expected return (ER) and the standard deviation (SD) of a port- folio consisting of the risk-free asset and the risky asset (equity), correspon- ding to the following proportions y held in each asset. Share of T-bill (1-y) 1 0.5 Equity (y) 0 0.5 0 1 -0.5 1.5 c) Plot a graph of the expected return against the standard deviation for each value of y and indicate on the graph the proportions of each asset held.
Step by Step Solution
3.43 Rating (156 Votes )
There are 3 Steps involved in it
Step: 1

See step-by-step solutions with expert insights and AI powered tools for academic success
Step: 2

Step: 3

Ace Your Homework with AI
Get the answers you need in no time with our AI-driven, step-by-step assistance
Get Started


