

Question
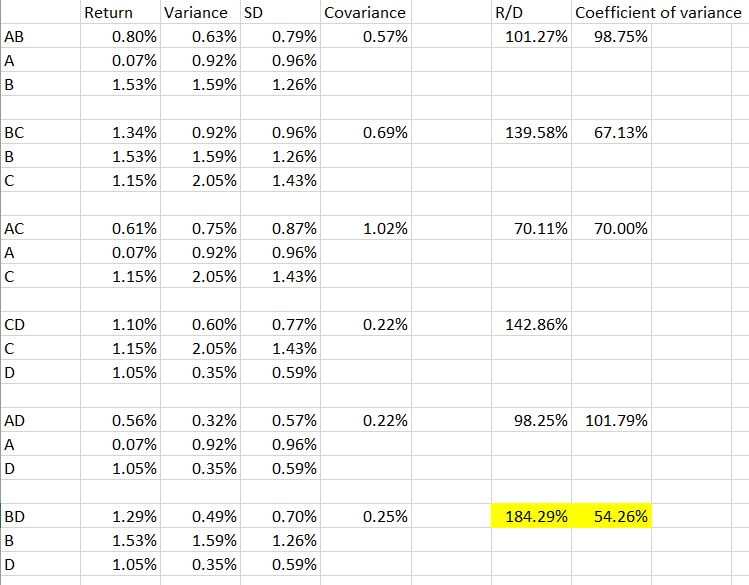
The risk-averse investor would choose to invest in Portfolio BD (FBU &WHS) FBU: Fletcher Building Limited WHS: The Warehouse Group Limited The following are return
The risk-averse investor would choose to invest in Portfolio BD (FBU &WHS)
FBU: Fletcher Building Limited
WHS: The Warehouse Group Limited
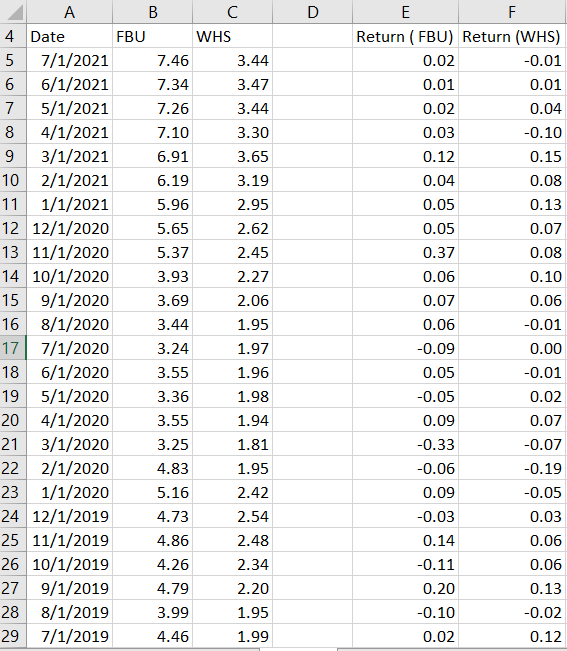
The following are return of two companies:
Requirement:
Draw a portfolio graph (showing Risk on the X-axis and Return on the Y-axis) for the investment portfolio
that you have chosen in (B&D) above for a range of investment weights that you could choose from (i.e.,
you could invest 5% in one company and 95% in the other or 10% in one company and 90% in the other
and so on). Determine from the portfolio graph the minimum risk you could obtain for this portfolio
and the respective weightings that should be invested in each of the securities in the portfolio. Please Show all working steps.
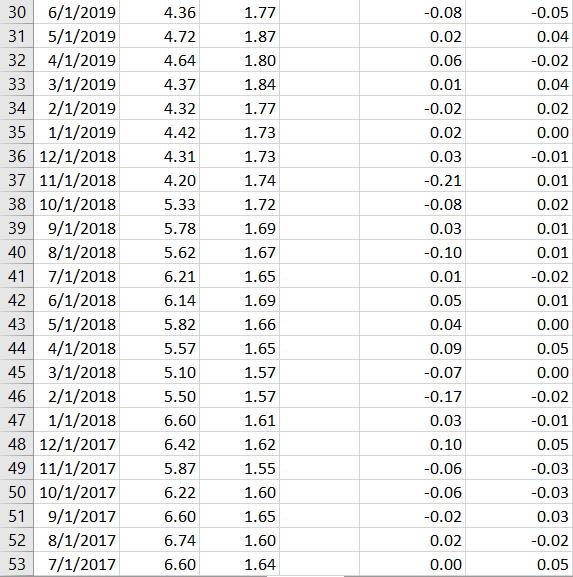
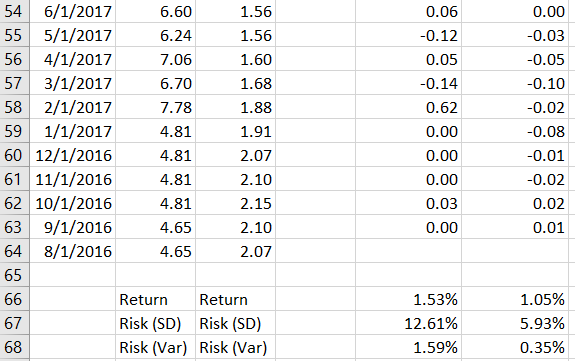
D B 4 Date FBU WHS 5 7/1/2021 7.46 3.44 6 6/1/2021 7.34 3.47 7 5/1/2021 7.26 3.44 8 4/1/2021 7.10 3.30 9 3/1/2021 6.91 3.65 10 2/1/2021 6.19 3.19 11 1/1/2021 5.96 2.95 12 12/1/2020 5.65 2.62 13 11/1/2020 5.37 2.45 14 10/1/2020 3.93 2.27 15 9/1/2020 3.69 2.06 16 8/1/2020 3.44 1.95 17 7/1/2020 3.24 1.97 18 6/1/2020 3.55 1.96 19 5/1/2020 3.36 1.98 20 4/1/2020 3.55 1.94 21 3/1/2020 3.25 1.81 22 2/1/2020 4.83 1.95 23 1/1/2020 5.16 2.42 24 12/1/2019 4.73 2.54 25 11/1/2019 4.86 2.48 26 10/1/2019 4.26 2.34 27 9/1/2019 4.79 2.20 28 8/1/2019 3.99 1.95 29 7/1/2019 4.46 1.99 E F Return (FBU) Return (WHS) 0.02 -0.01 0.01 0.01 0.02 0.04 0.03 -0.10 0.12 0.15 0.04 0.08 0.05 0.13 0.05 0.07 0.37 0.08 0.06 0.10 0.07 0.06 0.06 -0.01 -0.09 0.00 0.05 -0.01 -0.05 0.02 0.09 0.07 -0.33 -0.07 -0.06 -0.19 0.09 -0.05 -0.03 0.03 0.14 0.06 -0.11 0.06 0.20 0.13 -0.10 -0.02 0.02 0.12 30 6/1/2019 31 5/1/2019 32 4/1/2019 33 3/1/2019 34 2/1/2019 35 1/1/2019 36 12/1/2018 37 11/1/2018 38 10/1/2018 39 9/1/2018 40 8/1/2018 41 7/1/2018 42 6/1/2018 43 5/1/2018 44 4/1/2018 45 3/1/2018 46 2/1/2018 47 1/1/2018 48 12/1/2017 49 11/1/2017 50 10/1/2017 51 9/1/2017 52 8/1/2017 53 7/1/2017 -0.05 0.04 -0.02 0.04 0.02 0.00 -0.01 0.01 0.02 0.01 0.01 -0.02 4.36 4.72 4.64 4.37 4.32 4.42 4.31 4.20 5.33 5.78 5.62 6.21 6.14 5.82 5.57 5.10 5.50 6.60 6.42 5.87 6.22 6.60 6.74 6.60 1.77 1.87 1.80 1.84 1.77 1.73 1.73 1.74 1.72 1.69 1.67 1.65 1.69 1.66 1.65 1.57 1.57 -0.08 0.02 0.06 0.01 -0.02 0.02 0.03 -0.21 -0.08 0.03 -0.10 0.01 0.05 0.04 0.09 -0.07 -0.17 0.03 0.10 -0.06 -0.06 -0.02 0.02 0.00 0.01 0.00 0.05 0.00 -0.02 1.61 -0.01 1.62 1.55 1.60 1.65 1.60 1.64 0.05 -0.03 -0.03 0.03 -0.02 0.05 54 6/1/2017 6.60 1.56 55 5/1/2017 6.24 1.56 56 4/1/2017 7.06 1.60 57 3/1/2017 6.70 1.68 58 2/1/2017 7.78 1.88 59 1/1/2017 4.81 1.91 60 12/1/2016 4.81 2.07 61 11/1/2016 4.81 2.10 62 10/1/2016 4.81 2.15 63 9/1/2016 4.65 2.10 64 8/1/2016 4.65 2.07 65 Return Return 67 Risk (SD) Risk (SD) 68 Risk (Var) Risk (Var) 0.06 -0.12 0.05 -0.14 0.62 0.00 0.00 0.00 0.03 0.00 0.00 -0.03 -0.05 -0.10 -0.02 -0.08 -0.01 -0.02 0.02 0.01 66 1.53% 12.61% 1.59% 1.05% 5.93% 0.35% R/D Coefficient of variance 101.27% 98.75% AB B Return Variance SD 0.80% 0.63% 0.07% 0.92% 1.53% 1.59% Covariance 0.79% 0.57% 0.96% 1.26% 0.69% 139.58% 67.13% BC B 1.34% 1.53% 1.15% 0.92% 1.59% 2.05% 0.96% 1.26% 1.43% 1.02% 70.11% 70.00% AC A 0.61% 0.07% 1.15% 0.75% 0.92% 2.05% 0.87% 0.96% 1.43% 0.22% 142.86% CD D 1.10% 1.15% 1.05% 0.60% 2.05% 0.35% 0.77% 1.43% 0.59% 0.22% 98.25% 101.79% AD D 0.56% 0.07% 1.05% 0.32% 0.92% 0.35% 0.57% 0.96% 0.59% 0.25% 184.29% 54.26% BD B D 1.29% 1.53% 1.05% 0.49% 1.59% 0.35% 0.70% 1.26% 0.59%Step by Step Solution
There are 3 Steps involved in it
Step: 1

Get Instant Access to Expert-Tailored Solutions
See step-by-step solutions with expert insights and AI powered tools for academic success
Step: 2

Step: 3
Ace Your Homework with AI
Get the answers you need in no time with our AI-driven, step-by-step assistance
Get Started
Restoring Demand In The World Economy Trade Finance And Technology
Authors: Joseph Halevi, Jean-Marc Fontaine
1st Edition
1858984580, 9781858984582