Question
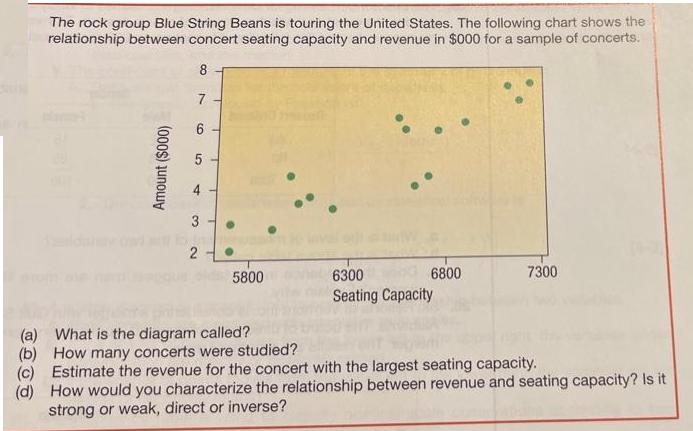
The rock group Blue String Beans is touring the United States. The following chart shows the relationship between concert seating capacity and revenue in

The rock group Blue String Beans is touring the United States. The following chart shows the relationship between concert seating capacity and revenue in $000 for a sample of concerts. 8 Amount ($000) 7 6 5 4 H 3. 2 5800 6800 6300 Seating Capacity 7300 (a) What is the diagram called? (b) How many concerts were studied? (c) Estimate the revenue for the concert with the largest seating capacity. (d) How would you characterize the relationship between revenue and seating capacity? Is it strong or weak, direct or inverse?
Step by Step Solution
3.29 Rating (146 Votes )
There are 3 Steps involved in it
Step: 1
a The following data for the Seating Capacity and Amount 100000s variables are provided to construct ...
Get Instant Access to Expert-Tailored Solutions
See step-by-step solutions with expert insights and AI powered tools for academic success
Step: 2

Step: 3

Ace Your Homework with AI
Get the answers you need in no time with our AI-driven, step-by-step assistance
Get StartedRecommended Textbook for
Basic Business Statistics Concepts And Applications
Authors: Mark L. Berenson, David M. Levine, Timothy C. Krehbiel
12th Edition
132168383, 978-0132168380
Students also viewed these Accounting questions
Question
Answered: 1 week ago
Question
Answered: 1 week ago
Question
Answered: 1 week ago
Question
Answered: 1 week ago
Question
Answered: 1 week ago
Question
Answered: 1 week ago
Question
Answered: 1 week ago
Question
Answered: 1 week ago
Question
Answered: 1 week ago
Question
Answered: 1 week ago
Question
Answered: 1 week ago
Question
Answered: 1 week ago
Question
Answered: 1 week ago
Question
Answered: 1 week ago
Question
Answered: 1 week ago
Question
Answered: 1 week ago
Question
Answered: 1 week ago
Question
Answered: 1 week ago
Question
Answered: 1 week ago
Question
Answered: 1 week ago
Question
Answered: 1 week ago
Question
Answered: 1 week ago
View Answer in SolutionInn App


