Question: The sales at a company has a normal distribution with a mean of 8000 and a standard deviation of 1000. The per unit profit is
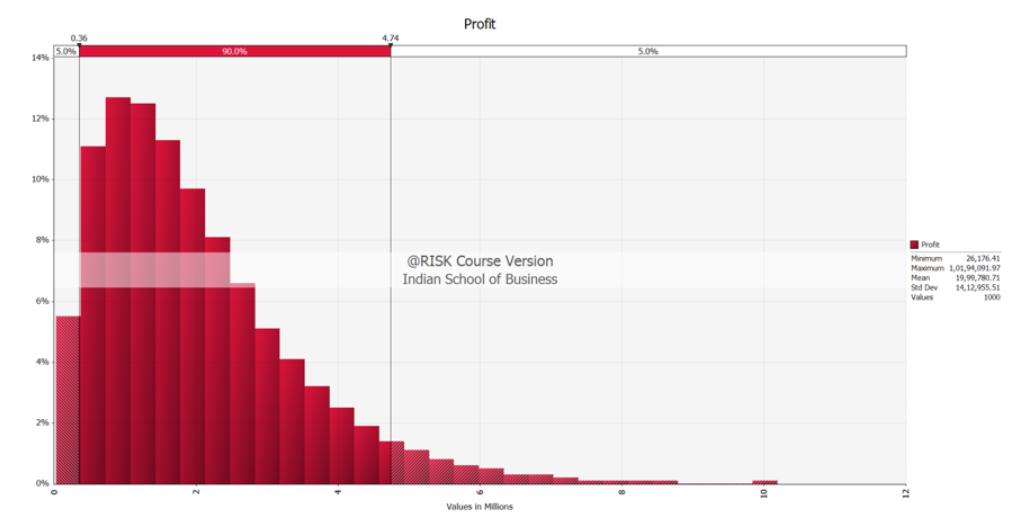
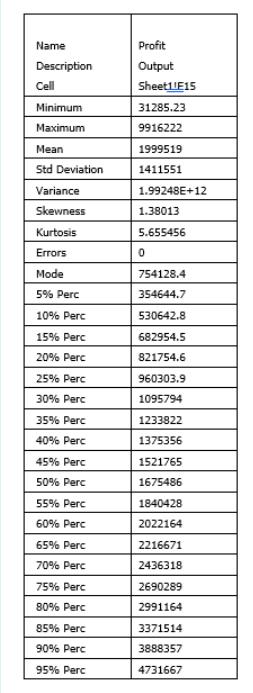
The sales at a company has a normal distribution with a mean of 8000 and a standard deviation of 1000. The per unit profit is INR 200. Assume for simplicity that there are no fixed costs. A marketing firm now offers to run an advertising campaign. The marketing firms expects that the campaign will boost the sales and thus raise profits. It has built a simulation model to understand what the boost in profits will be. Note that the sample size (number of iterations in @Risk) is 1000. Figure 1 displays the results of the simulation and Table 1 describes the simulation summary statistics. However, the marketing firm will charge INR 3,50,000 to run the campaign (note that the cost of running the campaign is not factored in the simulation results).


Based on the simulation model, what is an estimate of the expected net profit (including the cost of the campaign?
Select one:
a. 31285
b. 1999519
c. 754128
d. 1649519
Based on the simulation model, what is an estimate of the probability that the company would make more money (again after factoring in the cost of the campaign) than the average profit it was making previously?
Select one:
a. 60%
b. 75%
c. 30%
d. 40%
Based on the simulation model and assuming the company is interested in profit maximization, should the company take up the marketing firm’s offer to run the advertising campaign? That is, does it make more money (in net) on average now than it was making before?
Select one:
a. Cannot conclude (at the 95% confidence level)
b. Yes (at the 95% confidence level)
c. No (at the 95% confidence level)
14% 12% 10% 8% 6% 4% 0.36 5.0% 90.0% 4.74 Profit @RISK Course Version Indian School of Business Values in Millions 5.0% Profit Minimum Maximum 1,01,94,091.97 Mean 19,99,780.71 26,176.41 Std Dev 14,12,955.51 1000 Val Name Description Cell Minimum Maximum Mean Std Deviation Variance Skewness Kurtosis Errors Mode 5% Perc 10% Perc 15% Perc 20% Perc 25% Perc 30% Perc 35% Perc 40% Perc 45% Perc 50% Perc 55% Perc 60% Perc 65% Perc 70% Perc 75% Perc 80% Perc 85% Perc 90% Perc 95% Perc Profit Output Sheet1 E15 31285.23 9916222 1999519 1411551 1.99248E+12 1.38013 5.655456 0 754128.4 354644.7 530642.8 682954.5 821754.6 960303.9 1095794 1233822 1375356 1521765 1675486 1840428 2022164 2216671 2436318 2690289 2991164 3371514 3888357 4731667
Step by Step Solution
3.48 Rating (174 Votes )
There are 3 Steps involved in it
1 In the previous year the profit made was 8000200 INR 1600000 By factoring the campaig... View full answer

Get step-by-step solutions from verified subject matter experts


