

Answered step by step
Verified Expert Solution
Question
1 Approved Answer
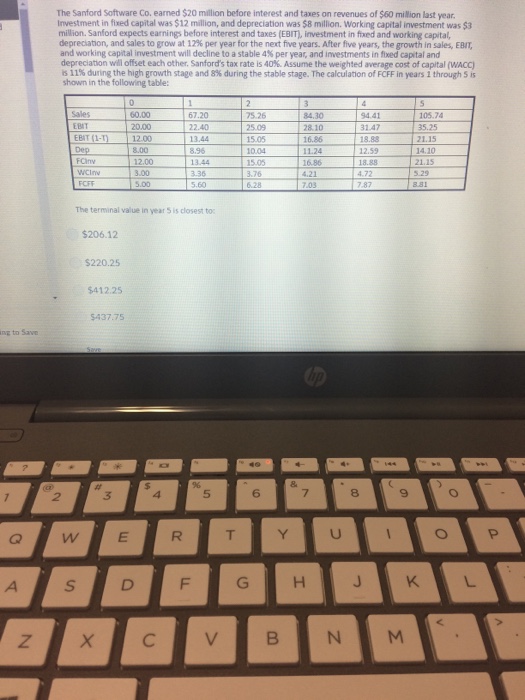
The Sanford Software Co. earned $20 million before interest and taxes on revenues of $60 million last year Investment in fixed capital was $12 million,
Step by Step Solution
There are 3 Steps involved in it
Step: 1

Get Instant Access to Expert-Tailored Solutions
See step-by-step solutions with expert insights and AI powered tools for academic success
Step: 2

Step: 3
Ace Your Homework with AI
Get the answers you need in no time with our AI-driven, step-by-step assistance
Get Started
The Exchange Traded Funds Manual
Authors: Gary L. Gastineau
2nd Edition
0470482338, 978-0470482339