Answered step by step
Verified Expert Solution
Question
1 Approved Answer
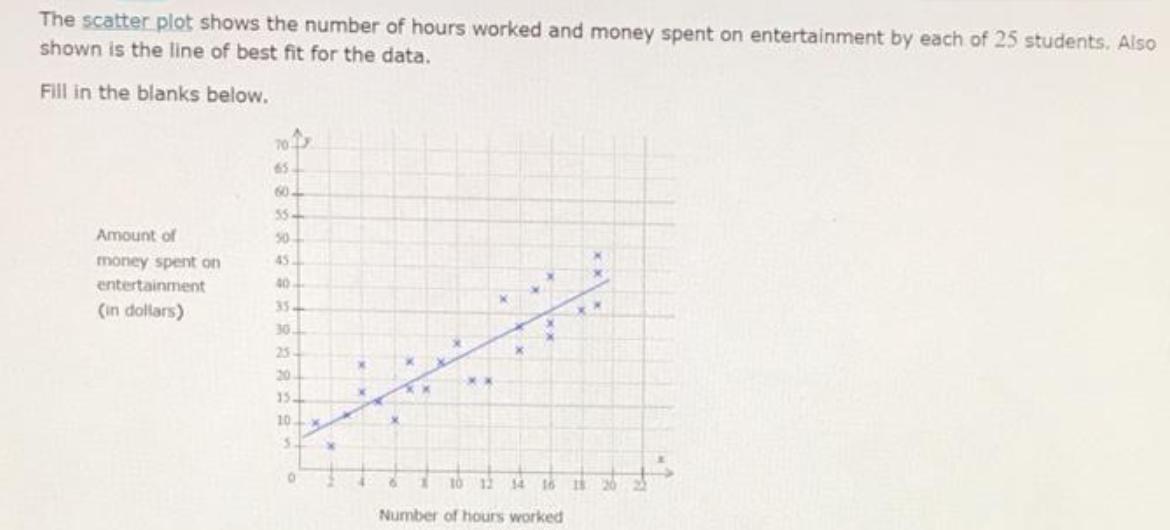
The scatter plot shows the number of hours worked and money spent on entertainment by each of 25 students. Also shown is the line


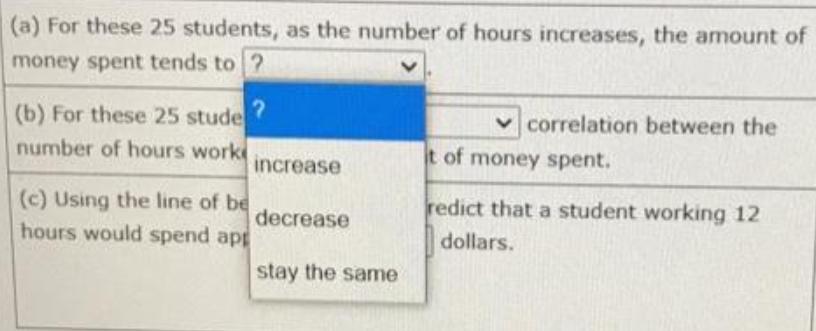
The scatter plot shows the number of hours worked and money spent on entertainment by each of 25 students. Also shown is the line of best fit for the data. Fill in the blanks below. 65 60 55- Amount of 50 money spent on 45. entertainment 40 (in dollars) 35. 30. 25 20 15 10. S 14 16 18 Number of hours worked (a) For these 25 students, as the number of hours increases, the amount of money spent tends to ? (b) For these 25 students, there is ? correlation between the number of hours worked and the amount of money spent. (c) Using the line of best fit, we would predict that a student working 12 hours would spend approximately ? dollars. (a) For these 25 students, as the number of hours increases, the amount of money spent tends to ? (b) For these 25 stude number of hours work ? correlation between the increase t of money spent. (c) Using the line of be decrease hours would spend app redict that a student working 12 dollars. stay the same
Step by Step Solution
There are 3 Steps involved in it
Step: 1

Get Instant Access to Expert-Tailored Solutions
See step-by-step solutions with expert insights and AI powered tools for academic success
Step: 2

Step: 3

Ace Your Homework with AI
Get the answers you need in no time with our AI-driven, step-by-step assistance
Get Started


