

Answered step by step
Verified Expert Solution
Question
1 Approved Answer
< The scatter plots below show the results of a survey of 20 randomly selected males 100- NO 60 110- 50 100 40 90
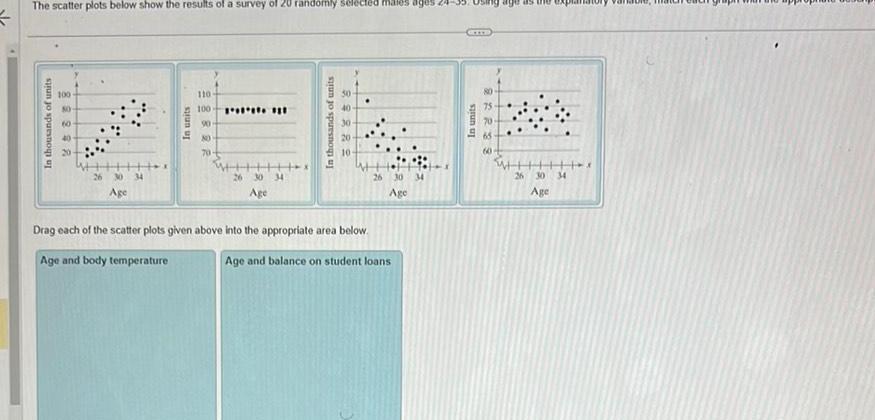
< The scatter plots below show the results of a survey of 20 randomly selected males 100- NO 60 110- 50 100 40 90 30 40 NO 20 20 70- 10- 26 30 34 26 30 34 Age 26 30 34 Age Drag each of the scatter plots given above into the appropriate area below. Age and body temperature Age and balance on student loans 60 26 30 34 Age
Step by Step Solution
There are 3 Steps involved in it
Step: 1

Get Instant Access to Expert-Tailored Solutions
See step-by-step solutions with expert insights and AI powered tools for academic success
Step: 2

Step: 3
Ace Your Homework with AI
Get the answers you need in no time with our AI-driven, step-by-step assistance
Get Started
Forecasting Time Series And Regression
Authors: Bruce L. Bowerman, Richard O'Connell, Anne Koehler
4th Edition
0534409776, 9780534409777