

Question
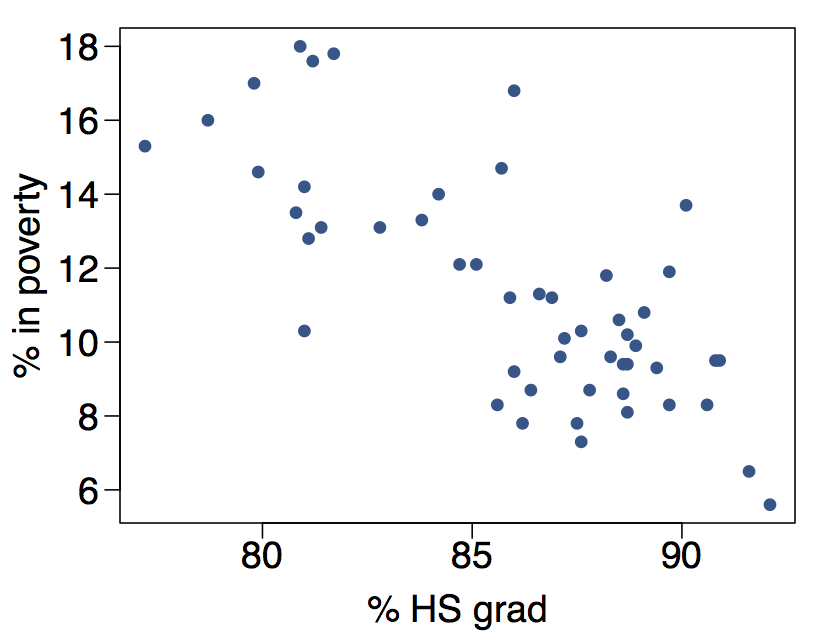
The scatterplot below shows the relationship between poverty rate, y, in the 51 states in the US (including DC) and the high school graduation rate,
The scatterplot below shows the relationship between poverty rate, y, in the 51 states in the US (including DC) and the high school graduation rate, x. The linear regression equation for predicting poverty is as follows:
y=64.68?0.62xy=64.68-0.62x
The actual high school graduation rate for a certain state is 83.3%, and the actual poverty rate in that state is 11.834%. What is theresidualfor this observation?
Step by Step Solution
There are 3 Steps involved in it
Step: 1

Get Instant Access to Expert-Tailored Solutions
See step-by-step solutions with expert insights and AI powered tools for academic success
Step: 2

Step: 3
Ace Your Homework with AI
Get the answers you need in no time with our AI-driven, step-by-step assistance
Get Started
Stability Of Functional Equations In Banach Algebras
Authors: Yeol Je Cho, Choonkil Park, Themistocles M Rassias, Reza Saadati
1st Edition
3319187082, 9783319187082