Answered step by step
Verified Expert Solution
Question
1 Approved Answer
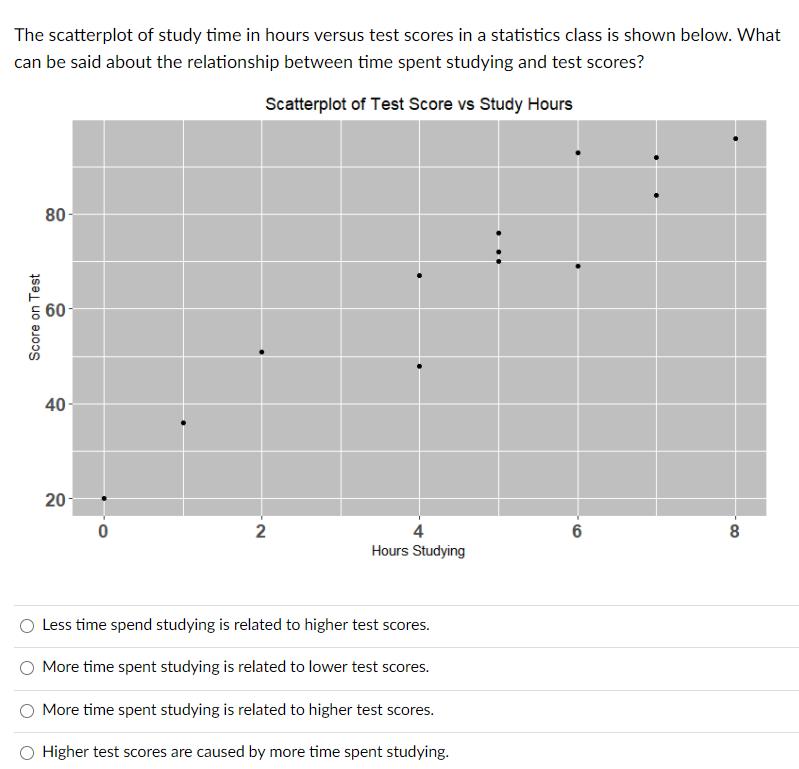
The scatterplot of study time in hours versus test scores in a statistics class is shown below. What can be said about the relationship


The scatterplot of study time in hours versus test scores in a statistics class is shown below. What can be said about the relationship between time spent studying and test scores? Scatterplot of Test Score vs Study Hours Score on Test 80- 60- 60 40- 20 0 2 4 Hours Studying 6 8 Less time spend studying is related to higher test scores. More time spent studying is related to lower test scores. More time spent studying is related to higher test scores. Higher test scores are caused by more time spent studying.
Step by Step Solution
There are 3 Steps involved in it
Step: 1

Get Instant Access to Expert-Tailored Solutions
See step-by-step solutions with expert insights and AI powered tools for academic success
Step: 2

Step: 3

Ace Your Homework with AI
Get the answers you need in no time with our AI-driven, step-by-step assistance
Get Started


